8
$\begingroup$

If I have the below functional form for an OLS regression, how do I interpret the $x$ and $x^2$? I cannot interpret them separately, correct? Do I interpret them as a summation of the two coefficients, so the effect of a one unit change of $x$ on $y$ is $0.5 + 0.3 = 0.8$?

$$ y = a + 0.5x + 0.3x^2 + e $$


Update: Now with 2 squared terms, and one that is an interaction term with the other and a binary variable, is there no rule for how to interpret the coefficients for all values of $x$? Or does it depend on the value of $x$?
\begin{align} y = 0.04\; &+\; 0.05\times {\rm drop}\; +\; 0.008\times {\rm season}\; -\; 0.0004\times {\rm season}^2 \\ &+\; 0.002\times {\rm dropseason}\; -\; 0.0003\times {\rm dropseason}^2\; -\; 0.029\times p \\ &-\; 0.01\times r_1\; +\; 0.003\times r_2\; +\; 0.01\times r_3\; +\; 0.003\times v_5\; +\; e \end{align}

$\endgroup$
4

3 Answers 3

15
$\begingroup$

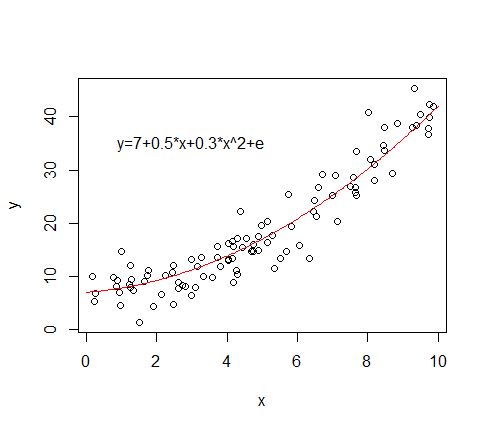
Such an equation describes a curved relationship between $y$ and $x$ - a parabola:

enter image description here

(This particular set of parameters correspond to a minimum at $x= -\frac{_5}{^6}$, just off the left margin of this plot.)

Consequently, you should keep all terms in the same x-variable together, since they describe the way $y$ is related to $x$.


Do I interpret them as a summation of the two coefficients, so the effect of a one unit change of x on y is 0.5 + 0.3 = 0.8.

No. The effect of the $x^2$ term on a one-unit change in $x$ is not constant.

Consider increasing $x$ from 0 to 1 and then from 10 to 11:

At $0$, the expected value of $y$ is $a$ (a=7 in my plot)
At $1$, the expected value of $y$ is $a+0.5\times 1+0.3\times 1^2$

The average increase in $y$ when $x$ increases from 0 to 1 is $0.5\times 1+0.3\times 1^2 = 0.8$

At $10$, the expected value of $y$ is $a+0.5\times 10+0.3\times 10^2$ (a=7 in my plot)
At $11$, the expected value of $y$ is $a+0.5\times 11+0.3\times 11^2$

The average increase in $y$ when $x$ increases from 10 to 11 is $0.5\times (11-10)+0.3\times (11^2-10^2) = 6.8$

So there's not one single number -- it depends on which $x$ you look at.

It may be useful to describe the effect of a unit change at some low value, some high value and somewhere in between.

$\endgroup$
9
$\begingroup$

It doesn't pay to interpret them separately. They are connected. The formula for the vertex in a quadratic equation $y = a x^{2} + b x + c$ is $-\frac{b}{2a}$. The effect of changing $x$ from $s$ to $t$ is $a (t^{2} - s^{2}) + b (t - s)$. In a regression setting I often set $s$ to the first quartile of $x$ and $t$ to the $3^{\textrm{rd}}$ quartile, so as to estimate the inter-quartile-range $x$ effect.

$\endgroup$
0
$\begingroup$

The most straightforward way to interpret is through multivariate Taylor expansion. If you don't know what is it, then forget what I just wrote.

If you take a derivative of the model specification, you'll see that your coefficients are the Taylor series coefficients.

$\endgroup$

Your Answer

By clicking “Post Your Answer”, you agree to our terms of service and acknowledge you have read our privacy policy.

Not the answer you're looking for? Browse other questions tagged or ask your own question.