1
$\begingroup$

I am analyzing an experiment comparing the effect of treatment A vs. B on the matched subject. Here are the measurements on 34 subjects:

 A     B
-1.15 -1.16
-1.13 -0.94
-0.16 -1.18
-0.37 -1.20
-1.09 -1.20
-1.20 -1.20
-0.94 -1.20
-0.84 -1.16
-1.18 -1.17
-1.20 -1.11
-0.78 -0.68
-0.83 -0.73
-1.05 -1.20
-0.71 -1.20
 0.07  0.12
-1.20 -0.98
-1.20 -1.20
-1.02 -1.17
-0.28 -0.84
 1.33  1.47
-1.19 -1.20
-1.20 -1.17
-0.40 -1.20
 0.66 -0.21
-0.63  0.21
-0.88 -1.16
-0.46 -1.20
-0.76 -1.20
-0.38 -1.20
-0.67 -0.97
-0.90 -1.20
-0.90 -1.20
-1.20 -1.15
-1.01 -0.79

The differences between the two treatment (dat[,"A"]-dat[,"B"]) looks normally distributed. I first applied a paired t-test:

t.test(dat$A, dat$B, alternative = c("two.sided"), mu = 0, paired = TRUE)

Paired t-test
data:  dat$A and dat$B 
t = 2.894, df = 33, p-value = 0.006692
alternative hypothesis: true difference in means is not equal to 0 
95 percent confidence interval:
 0.05870022 0.33659390 
sample estimates:
mean of the differences 
              0.1976471 

The paired t-test indicates that on average treatment A has a significantly higher measurement than treatment B.

On the other hand, I applied a linear model on A~B:

mod1 <- lm(A ~ B, data=dat)

Coefficients:
        Estimate Std. Error t value Pr(>|t|)    
(Intercept) -0.03345    0.12739  -0.263    0.795    
B            0.75111    0.11801   6.365 3.79e-07 ***

The 95% confidence interval of the coefficient for B (0.51-0.99) does not cover 1. This result indicates that treatment A has on average a smaller measurement than treatment B, which is contradictory to the findings from the t-test.

Can anyone help me to explain these contradictory findings?

and to expand my question: Does a paired t-test (test mean of difference against 0) equal to a linear regression without intercept (test the coefficient against 1)? I mean in terms of testing against the null hypothesis, rather than the estimate or the meaning of the coefficient. Because both tests are testing against the null hypothesis that $B_{i}-A_{i}=\epsilon_{i}$.

$\endgroup$
8
  • $\begingroup$ You are partly right: The smaller the pairwise differences, the closer the points will scatter around the line through zero with slope 1. But your two analyses are not similar, for instance the t test only checks for mean differences, not for individual differences. $\endgroup$
    – Michael M
    Commented Jul 24, 2014 at 12:02
  • $\begingroup$ They don't test the same thing at all. The regression could indicate how much more sensitive the paired t-test would be compared to an independent one but the coefficient can be substantial with absolutely no paired t-test effect (and vice versa). $\endgroup$
    – John
    Commented Jul 24, 2014 at 12:15
  • 3
    $\begingroup$ No, the null hypotheses are not equivalent (imagine a "X" shaped scatter plot: the mean difference will be around zero but the regression slope is 0, not 1). What I said is: If the individual differences are small, then the regression slope will be around 1. That's the only relation between the two approaches. They investigate different aspects of the relation between X and Y. $\endgroup$
    – Michael M
    Commented Jul 24, 2014 at 12:27
  • 1
    $\begingroup$ I don't get you. The only way you can run a paired sample t test with a regression in R is "lm(X - Y ~ 1)" and then check if the only parameter is zero or not. $\endgroup$
    – Michael M
    Commented Jul 24, 2014 at 12:57
  • 1
    $\begingroup$ In my formula, X and Y are as in your formula. It's easy to run and check if it is similar to the t-test. $\endgroup$
    – Michael M
    Commented Jul 24, 2014 at 13:19

2 Answers 2

3
$\begingroup$

The linear regression tests whether B "predicts" A. The t-test tests whether the means are different. If you wanted to run a regression that was equivalent to the t-test you would have to structure the data so that A and B were two levels of another variable, say "group" that took on the values of your data, and, as @MichaelMayer points out, you would need a random intercept to account for the pairing.

As an example of why the two are not the same, consider:

set.seed(123)
x <- rnorm(100)
y <- x + 0.0001 + rnorm(100, 0, .01)

mod1 <- lm(y ~ x)
summary(mod1)                 #pvalue has 15 0's
t.test(x, y, paired = TRUE)   #p value = 0.32

If you know x, you can give a very good estimate of y. But the means are equivalent.

$\endgroup$
3
  • 2
    $\begingroup$ The regression with "group" would need some random person intercept or other trick to be similar to a paired t test. $\endgroup$
    – Michael M
    Commented Jul 24, 2014 at 13:05
  • 1
    $\begingroup$ The equivalent paired t-test can be done using mixed models lme() function in nlme package. lme(measurement~treatment,random=~1 |subject,data=dat, method="ML") $\endgroup$ Commented Jul 24, 2014 at 15:21
  • $\begingroup$ Thanks @Peter Flom and Michael Mayer, with your two counter examples, it is now clear to me that the two tests are not testing the same thing. $\endgroup$ Commented Jul 24, 2014 at 15:49
1
$\begingroup$

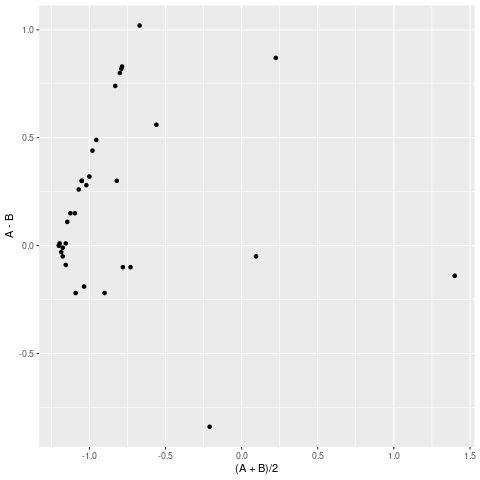
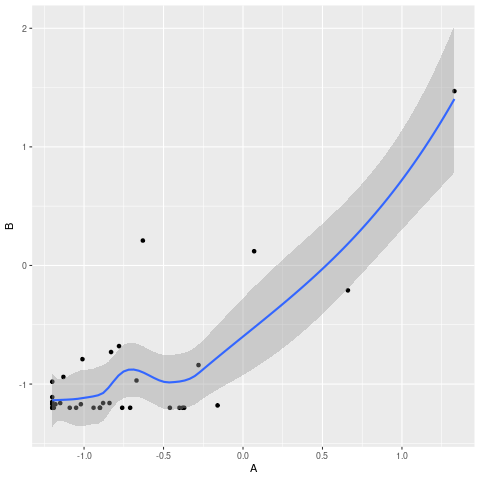
In addition to the excellent answer by @Peter Flom: This data shouts out for some plotting, something is going on here which we cannot interpret without knowing some context. First a simple plot with a smooth:

Scatterplot of A, B with a smooth

Then a Tukey mean-difference plot:

Tukey mean-difference plot

For reference and ease of further experimentation, the R code:

mydata <- 
"A     B 
-1.15 -1.16
-1.13 -0.94
-0.16 -1.18
-0.37 -1.20
-1.09 -1.20
-1.20 -1.20
-0.94 -1.20
-0.84 -1.16
-1.18 -1.17
-1.20 -1.11
-0.78 -0.68
-0.83 -0.73
-1.05 -1.20
-0.71 -1.20
0.07  0.12
-1.20 -0.98
-1.20 -1.20
-1.02 -1.17
-0.28 -0.84
1.33  1.47
-1.19 -1.20
-1.20 -1.17
-0.40 -1.20
0.66 -0.21
-0.63  0.21
-0.88 -1.16
-0.46 -1.20
-0.76 -1.20
-0.38 -1.20
-0.67 -0.97
-0.90 -1.20
-0.90 -1.20
-1.20 -1.15
-1.01 -0.79 "
md <- read.table(textConnection(mydata), header=TRUE)

library(ggplot2)

ggplot(md, aes(A,B)) + geom_point() + geom_smooth()

ggplot(md, aes( (A+B)/2, A-B)) + geom_point()  
$\endgroup$

Your Answer

By clicking “Post Your Answer”, you agree to our terms of service and acknowledge you have read our privacy policy.

Not the answer you're looking for? Browse other questions tagged or ask your own question.