3
$\begingroup$

Suppose that we have 2 sets of data $X = x_1, \dots, x_n$ and $Y = y_1, \dots, y_m$ and a test $T$ that tests the null hypothesis that these data come from a distribution with the same median. $T$ can be for example the Mann-Whitney U test or the Wilcoxon signed rank test (if we have paired data). In programming terms $T$ is a function that takes two samples and returns a p-value $$ p := T(X, Y) $$ Now let us suppose that we want to compare $X$ and $Y$ quantitatively. That is we want to say for example:

On the 5% significance level the median of $X$ is at least 5 times bigger than that of $Y$ but not more than 7 times bigger.

To do this we can test hypotheses for various multiples of $Y$: $$ p(c) := T(X, cY) $$

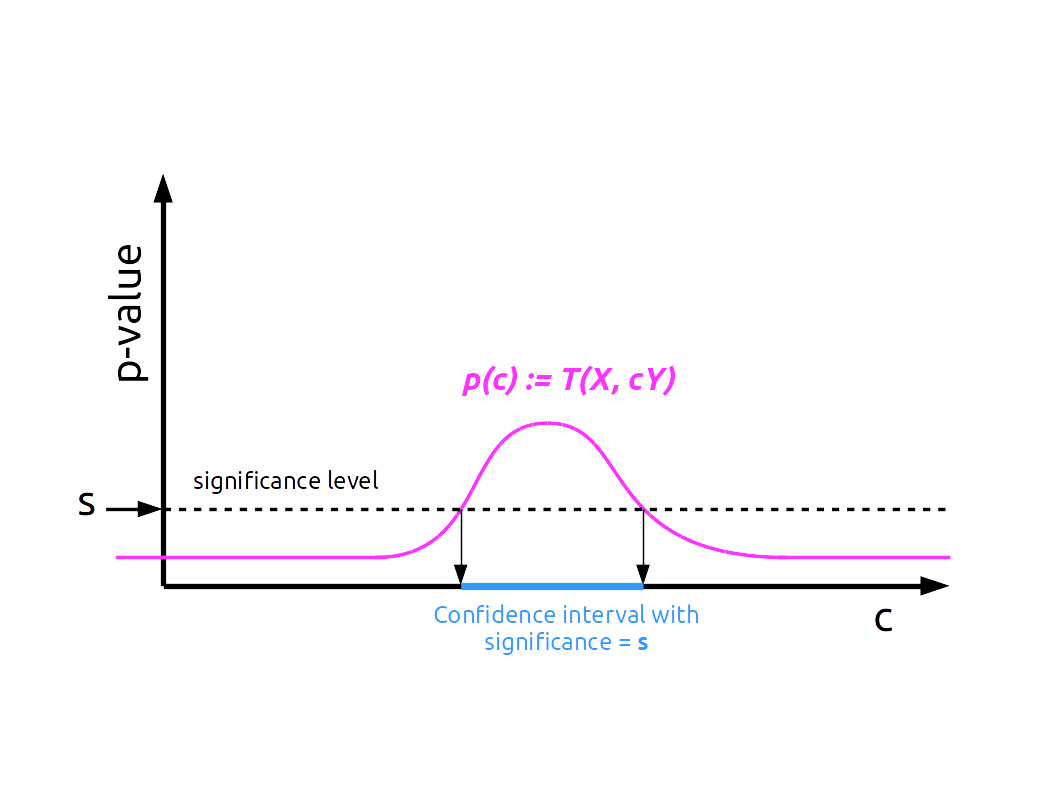
Then we plot the p-values and get something like this:
enter image description here

For very big and very small values of $c$ the p-value drops to a level determined by the sample size, while somewhere in the middle it will have one connected global maximum. If we select a certain significance level $s$ then the set $I_s$ defined by $$ I_s := \{c\in \mathbb{R} \text{ such that } p(c) > s \} $$ Is an interval $[a; b]$ and we can say that:

On the 5% significance level the median of $X$ is at least $a$ times bigger than that of $Y$ but not more than $b$ times bigger.

But what did we just do? Did we find the confidence interval for the median of $\frac{\textbf{x}}{\textbf{y}}$ where $\textbf{x, y}$ are the underlying random variables? Or is this methodology flawed? Is there such a method somewhere in literature? Is there some better way?

$\endgroup$
0

1 Answer 1

2
$\begingroup$

Very interesting approach. First thing, I would like to clarify that the null hypothesis of your test is that the dsitributions are identical and independent and the alternative is that the distributions are independent and differ by a horizontal shift (interpreted as a difference in median).

Formally, a 95% confidence interval is a function associating to every sample a real interval that has a 0.95 probability of containing some value of interest if some hypotheses are met. In your case the value of interest is the ratio of the medians but the hypotheses have not been clearly defined. A potential complication with this approach is that for some $c$ values, the conditions under which the Wilcoxon test may be interpreted as a “test for the median” may not be met (see this question about the Wilcoxon test not being a test for the median).

Without clearer assumptions, I think that it is impossible to decide whether there is a 95% chance that the interval you obtain by this process contains the true ratio of the medians. Here is an example in R to show this.

set.seed(123)
x <- rexp(10000)
y <- rexp(10000)
x <- x - median(x) + 1 # median of x is 1.
y <- median(y) - y + 1 # median of y is 1.
for (c in c(.1,.5,1,2,10)) print(wilcox.test(x, c*y)$p.value)
# P-values: 0, 0, 2.408945e-115, 1.101001e-191, 0

The p-value does not seem to ever reach the 5% level, even for the value $c=1$. You could rerun this example with different random seeds and see that this has nothing to do with this sample. The way x and y are built is such that your procedure would never contain the right value $c =1$. Actually, the interval will always be empty.

$\endgroup$

Your Answer

By clicking “Post Your Answer”, you agree to our terms of service and acknowledge you have read our privacy policy.

Not the answer you're looking for? Browse other questions tagged or ask your own question.