16
votes
$\begingroup$

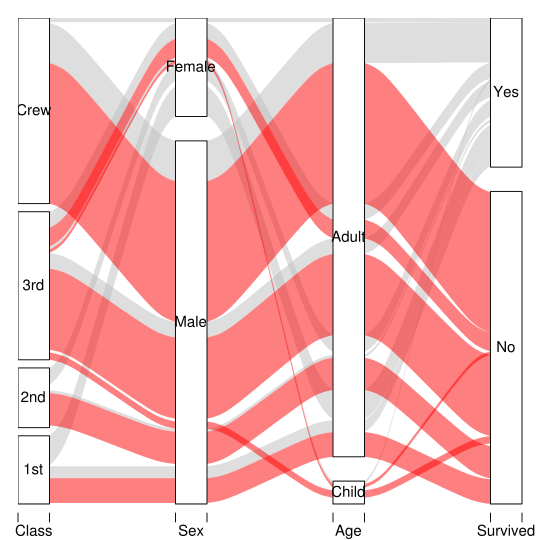
Thanks to Tormod question (posted here) I came across the Parallel Sets plot. Here is an example for how it looks: enter image description here (It is a visualization of the Titanic dataset. Showing, for example, how most of the women that didn't survive belonged to the third class...)

I would love to be able to reproduce such a plot with R. Is that possible to do?

Thanks, Tal

$\endgroup$
2
  • 1
    $\begingroup$ For ideas on graphics, I always check the R graph gallery. Here's something from there that is somewhat like what you ask for: R Graph Gallery parallel. I found it by clicking parallel in the tag cloud, but there may be better options. $\endgroup$
    – Nick Sabbe
    Commented Jun 17, 2011 at 11:28
  • 1
    $\begingroup$ Thanks Nick. But this will not work for categorical data without major tweaking of the code (it's also probably not the best base of functions to built this with). I hope someone might have done something similar already... $\endgroup$
    – Tal Galili
    Commented Jun 17, 2011 at 12:04

2 Answers 2

25
votes
$\begingroup$

Here's a version using only base graphics, thanks to Hadley's comment. (For previous version, see edit history).
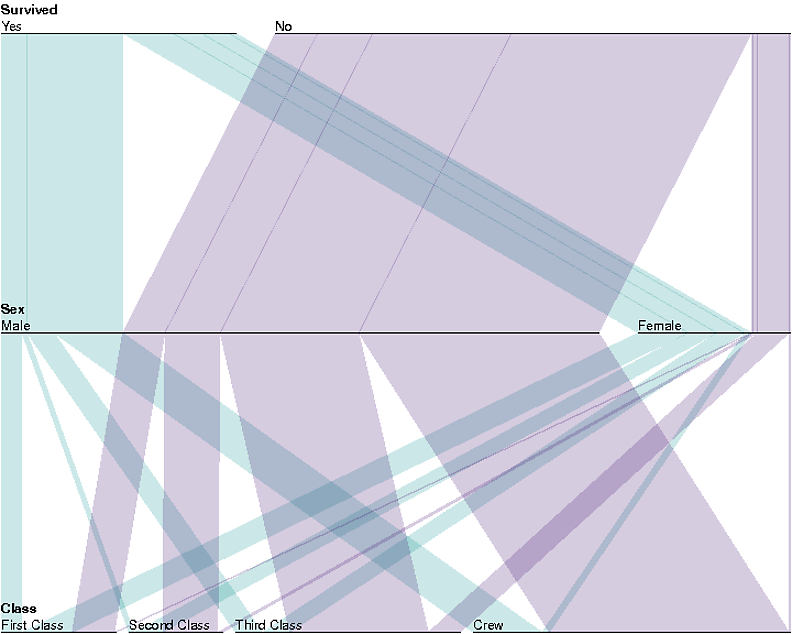
third try

parallelset <- function(..., freq, col="gray", border=0, layer, 
                             alpha=0.5, gap.width=0.05) {
  p <- data.frame(..., freq, col, border, alpha, stringsAsFactors=FALSE)
  n <- nrow(p)
  if(missing(layer)) { layer <- 1:n }
  p$layer <- layer
  np <- ncol(p) - 5
  d <- p[ , 1:np, drop=FALSE]
  p <- p[ , -c(1:np), drop=FALSE]
  p$freq <- with(p, freq/sum(freq))
  col <- col2rgb(p$col, alpha=TRUE)
  if(!identical(alpha, FALSE)) { col["alpha", ] <- p$alpha*256 }
  p$col <- apply(col, 2, function(x) do.call(rgb, c(as.list(x), maxColorValue = 256)))
  getp <- function(i, d, f, w=gap.width) {
    a <- c(i, (1:ncol(d))[-i])
    o <- do.call(order, d[a])
    x <- c(0, cumsum(f[o])) * (1-w)
    x <- cbind(x[-length(x)], x[-1])
    gap <- cumsum( c(0L, diff(as.numeric(d[o,i])) != 0) )
    gap <- gap / max(gap) * w
    (x + gap)[order(o),]
  }
  dd <- lapply(seq_along(d), getp, d=d, f=p$freq)
  par(mar = c(0, 0, 2, 0) + 0.1, xpd=TRUE )
  plot(NULL, type="n",xlim=c(0, 1), ylim=c(np, 1),
       xaxt="n", yaxt="n", xaxs="i", yaxs="i", xlab='', ylab='', frame=FALSE)
  for(i in rev(order(p$layer)) ) {
     for(j in 1:(np-1) )
     polygon(c(dd[[j]][i,], rev(dd[[j+1]][i,])), c(j, j, j+1, j+1),
             col=p$col[i], border=p$border[i])
   }
   text(0, seq_along(dd), labels=names(d), adj=c(0,-2), font=2)
   for(j in seq_along(dd)) {
     ax <- lapply(split(dd[[j]], d[,j]), range)
     for(k in seq_along(ax)) {
       lines(ax[[k]], c(j, j))
       text(ax[[k]][1], j, labels=names(ax)[k], adj=c(0, -0.25))
     }
   }           
}

data(Titanic)
myt <- subset(as.data.frame(Titanic), Age=="Adult", 
              select=c("Survived","Sex","Class","Freq"))
myt <- within(myt, {
  Survived <- factor(Survived, levels=c("Yes","No"))
  levels(Class) <- c(paste(c("First", "Second", "Third"), "Class"), "Crew")
  color <- ifelse(Survived=="Yes","#008888","#330066")
})

with(myt, parallelset(Survived, Sex, Class, freq=Freq, col=color, alpha=0.2))
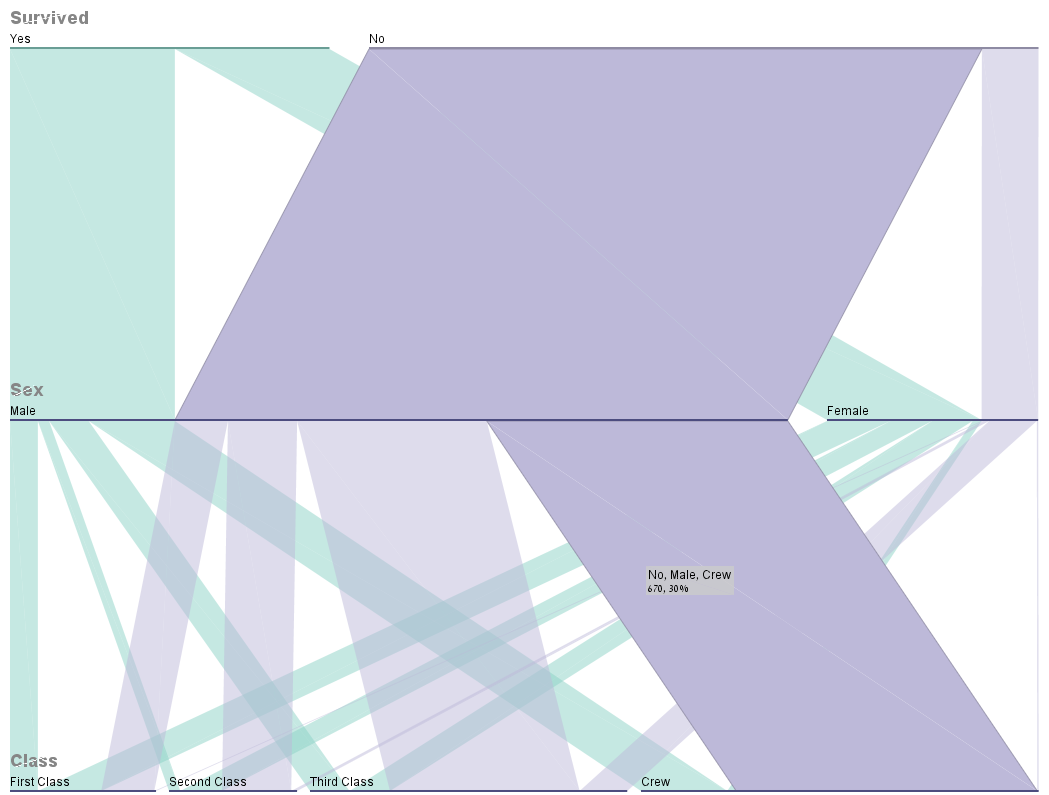
$\endgroup$
11
  • $\begingroup$ Aaron, wow, fantastic answer - I wish I could mark it V twice. Thank you! $\endgroup$
    – Tal Galili
    Commented Jun 17, 2011 at 16:23
  • 2
    $\begingroup$ Glad you like it. It was fun. :) The only tricky part is getting the places where the bars should start and end (which is in the getp subfunction); the rest is just drawing polygons. $\endgroup$ Commented Jun 17, 2011 at 16:26
  • 1
    $\begingroup$ Just another panel.text line. See edit. $\endgroup$ Commented Jun 17, 2011 at 20:14
  • 1
    $\begingroup$ You can do transparency in base graphics too. $\endgroup$
    – hadley
    Commented Jun 21, 2011 at 13:34
  • 2
    $\begingroup$ Right you are. I'd completely forgotten about that, being so used to the lattice way of doing things. For others who are interested, you add a couple more characters onto your color string, for example, #FF000080. ?rgb has details. $\endgroup$ Commented Jun 21, 2011 at 15:16
12
votes
$\begingroup$

Based on @Aaron code I developed something called "alluvial diagram". See http://bc.bojanorama.pl/2014/03/alluvial-diagrams/ Example below:

enter image description here

$\endgroup$
2

Not the answer you're looking for? Browse other questions tagged or ask your own question.