2
$\begingroup$

Consider the following dataset (it is the emission probability matrix of a Hidden Markov Model):

    H4K12Ac H3K9Ac  H3K4me2 H3K4me3 PolII   H3K18Ac H3K4me1 H3K36me3 H3K27me3
1   0.00    0.00    0.00    0.00    0.00    0.00    0.00    0.00    0.00
2   0.93    0.95    0.86    0.96    0.53    0.46    0.61    0.06    0.00
3   0.08    0.12    0.19    0.70    0.12    0.01    0.00    0.09    0.04
4   0.19    0.17    0.53    0.82    0.10    0.23    0.98    0.11    0.04
5   0.00    0.00    0.01    0.00    0.00    0.00    0.87    0.00    0.01
6   0.00    0.00    0.03    0.00    0.03    0.94    0.99    0.00    0.01
7   0.69    0.46    0.27    0.00    0.12    0.88    0.98    0.05    0.00
8   0.01    0.00    0.00    0.00    0.00    0.59    0.00    0.00    0.00
9   0.12    0.03    0.00    0.02    0.05    0.33    0.87    0.90    0.00
10  0.00    0.00    0.00    0.00    0.00    0.00    0.00    0.66    0.00
11  0.97    0.01    0.00    0.00    0.00    0.01    0.32    0.29    0.01
12  0.03    0.00    0.00    0.00    1.00    0.05    0.15    0.14    0.09
13  0.00    0.00    0.00    0.00    0.00    0.01    0.03    0.00    0.87

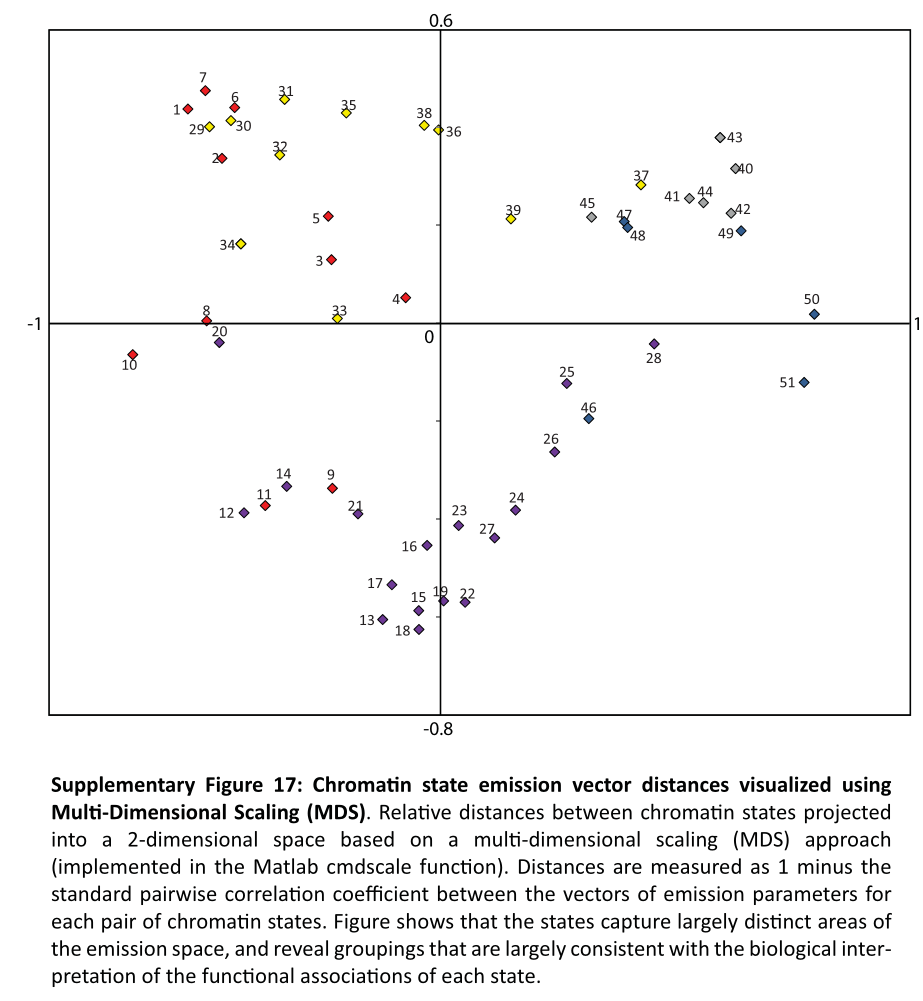
So we have 13 states and each state can emit some mark/emission with a certain probability. Now I'd like to do some MDS analysis on those data (based on a paper I am reading). Let us consider the results (from a 51 state HMM)
enter image description here

Question For what I understand, the position of each point on the graph is decided based on the column vectors (ie the emission vector). Or is it the other way around, i.e. the position of each point is decided based on the row vector which represents a specific state?

Secondary question: What does it mean by the standard pairwise correlation coefficient and how can I compute using my dataset?

$\endgroup$

2 Answers 2

1
$\begingroup$

In your example, the author used the cmdscale function in Matlab. That particular function uses a distance matrix (which is symmetric and has the same labels for rows and columns), and you haven't generated that yet. Remember, MDS is used to generate a more interpretable 2- (or 3-) dimensional projection of an n-dimensional set of distances. The pairwise correlation coefficient they mention refers to the metric used to calculate those distances. You will have to decide if the correlation coefficient or another metric is suitable for determining the distance/dissimilarity between your items (given the number of zeroes in your dataset, correlation is probably not a good choice).

In R at least, the distance matrix can be generated on the rows of your input matrix using the dist function. Some R code that will produce a similar plot using Euclidean distance (and without the point colours) for your data would be:

# assume your data is a matrix called x
d = dist( x, method="euclidean" )
mds = cmdscale( d, k=2 ) # use 2 dimensions
plot( mds, pch=23 ) # 23 specifies diamond symbols
text( mds, rownames(mds), pos=1 ) # place text labels above points

The distance metric and aesthetics can be modified as needed.

$\endgroup$
3
  • $\begingroup$ Thank you. I have a much better understanding now. Do you mind expanding on (given the number of zeroes in your dataset, correlation is probably not a good choice).? I don't have a statistics background so I am not sure why this is the case. Also, if I was to use correlation (just to see why its a bad idea), what would be a good formula to use? $\endgroup$
    – masfenix
    Commented Oct 24, 2014 at 14:41
  • $\begingroup$ It was more intuition that made me say that, I didn't have a formal reason in mind. Many zeroes will make a correlation much higher between the rows of your matrix than is probably indicated $\endgroup$
    – scottzed
    Commented Oct 24, 2014 at 18:47
  • $\begingroup$ (accidentally pressed enter above)... Also, the values aren't measurements, they're probabilities, so correlation doesn't make a lot of sense. You should submit a question asking what row-wise distance metric makes sense to use with a matrix of probabilities, I'm sure someone will have a better rationale than I can provide. $\endgroup$
    – scottzed
    Commented Oct 24, 2014 at 18:55
0
$\begingroup$

In your document you have the vectors on the columns. In other words it means that each state (i.e. H4K12Ac) can be seen as a vector. A state is different from another ones by the fact that they have different probabilities of emissions.

So it's true what scottzed says:

...
d = dist( x, method="euclidean" )
mds = cmdscale( d, k=2 ) # use 2 dimensions
...

but the calculation of the matrix distance (d) relies on the column: at the position d[1,3] you will find the computed distance between H4K12Ac and H3K4me2. On the diagonal you will find:

d[i,i]=0

since a state has no differences with itself.

In other words the MDS is a way to plot the differences from the elements belonging to dimension n on 2 dimensions such that you can have an overview on the differences!

$\endgroup$

Your Answer

By clicking “Post Your Answer”, you agree to our terms of service and acknowledge you have read our privacy policy.

Not the answer you're looking for? Browse other questions tagged or ask your own question.