20
$\begingroup$

I would like to conduct a forecast based on a multiple time series ARIMA-model with multiple exogeneous variables. Since I am not that skillfull with regards to neither statistics nor R I want to keep is as simple as possible (Trend forecast for 3 months is sufficient).

I have 1 dependent time series and 3-5 predictor time series, all monthly data, no gaps, same time "horizon".

I encountered the auto.arima function and asked myself if this would be a suitable solution for my problem. I have different commodity prices and prices of products made from them. All raw-data are non-stationary but via first-order differencing they all become stationary data. ADF, KPSS indicate this. (This means that I have tested for integration, right?).

My question now is: How do I apply this with the auto.arima function AND is ARIMA the right approach anyways? Some ppl already adviced me to use VAR, but is it possible with ARIMA too?

The following table is my data. Actually the data-set goes up til 105 observations, but the first 50 will do. Trend as well as seasonality are obviously of interest here.
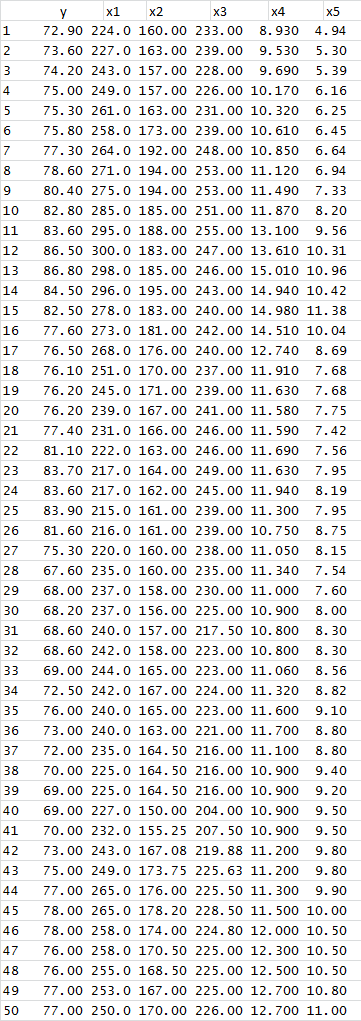
enter image description here

Thanks for any advices and help! Georg

$\endgroup$
2
  • 2
    $\begingroup$ please post your data so it can be downloaded . use excel . This could simply be a task to identify unnecessary (possibly significantly cross-correlated )input series. I don;t think that VAR is necessary or Principle Components useful for this problem $\endgroup$
    – IrishStat
    Commented Dec 10, 2014 at 21:48
  • $\begingroup$ I have done a script for it, have a look on: Repo: github.com/Gelsleichter/Auto-Arima-for-multiple-time-series $\endgroup$ Commented Oct 29, 2020 at 15:39

1 Answer 1

13
$\begingroup$

If your external regressors are causal for $y$, but not the other way around and do not cause each other, then ARIMA is definitely appropriate. VAR makes sense if your different time series all depend on each other.

For auto.arima() to work with external regressors, collect your regressors into a matrix X, which you feed into the xreg parameter of auto.arima(). (Of course, X must have the same number of rows as the time series y you are modeling.)

For forecasting, you will need the future values of your regressors, which you then again feed into the xreg parameter of forecast.

The help pages are ?auto.arima and ?forecast.Arima (note the capital A - this is not a typo. Don't ask me...).

$\endgroup$
5
  • 1
    $\begingroup$ (+1) You could elaborate a little bit on the idea of causality and how to test it. It may be helpful for completeness of your answer, as you mention that the decision to use ARIMA is determined by the direction of causality among the variables. Are you for example thinking about the Granger causality test or the Hausman test? Thanks. $\endgroup$
    – javlacalle
    Commented Nov 5, 2014 at 18:51
  • 3
    $\begingroup$ @javlacalle: I am not a very big fan of statistical tests for causality (of which the Granger test is the best known). I much prefer deciding about "probable causality" based on the subject matter. For instance, I wouldn't use a Granger test to assess whether a price reduction increases supermarket sales or the other way around. Nor whether GDP, exchange rates and job creation are mutually causal. In both cases the matter appears obvious enough, and a test in line with theory will not teach us anything, while a test contradicting theory will only be confusing (and probably no more than noise). $\endgroup$ Commented Nov 5, 2014 at 19:22
  • 2
    $\begingroup$ ... I know that I'm opening myself up to flames with my last comment ;-) $\endgroup$ Commented Nov 5, 2014 at 19:23
  • $\begingroup$ @ Stephan: Thanks for your input. Although my y is definitley caused by my regressors and not the other way, but my regressors definitetly correlate with each other and also should have more or less direct impacts on each other. According to your comment, this means that I should use VAR instead of arima, since this will avoid problems (?). I'm using a bundle of commodity/product prices here, which basically all are related to each other up to a certain point. The "raw-material" is my Y, products from the value chain, as well as side products etc. are my predictors. $\endgroup$
    – George
    Commented Nov 6, 2014 at 8:38
  • 2
    $\begingroup$ Knowing the context of the data is always helpful and the results from any analysis should be compared with our a priori knowledge. Some caution is advisable nonetheless. Intuition sometimes fails and the theories that are sometimes taken for granted rely on assumptions that are not supported by facts. But I understand what you mean and agree overall. $\endgroup$
    – javlacalle
    Commented Nov 6, 2014 at 8:40

Not the answer you're looking for? Browse other questions tagged or ask your own question.