2
$\begingroup$

I'm trying to work with U-statistics as described in Mardia and Jupp's 2000 book Directional Statistics (2). Specifically pages 220-2 there is a test for the equality of concentration parameters. The F statistic is easy enough to calculate (when the mean resultant length or R-bar >= .67), but I don't understand how to calculate the U-statistics, via variance stabilizing transformations, for when the R-bar <= .67.

In the case where R-bar < .44, the statistic is U1 (see Mardia and Jupp 1 screen cap attachment for formula). (Mardia and Jupp 2 is the screen cap for the formula when .44 <= R-bar <= .67.) What I don't understand is what to do with the g1(r)=inverse sine of (r/sqrt(5)) in equation 10.5.6 and the g1 stuff that is in the numerator of equation 10.5.5. Ditto for equations 10.5.8 and 10.5.9.
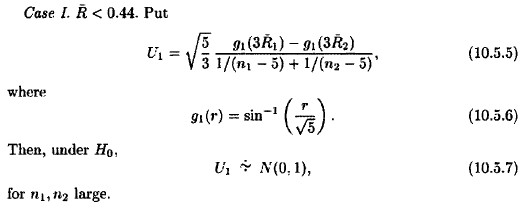
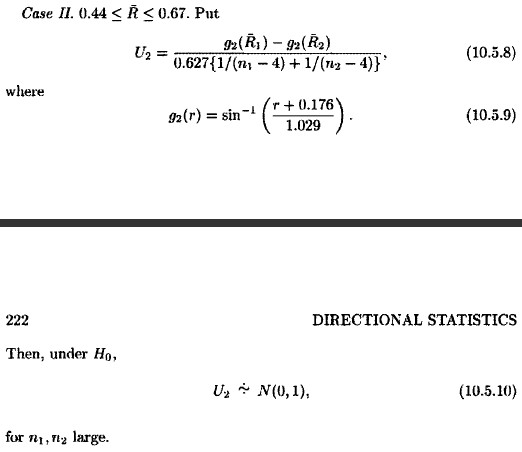
Mardia and Jupp 1

enter image description here

I have the R-bars calculated, I have the n's, or sample size. According to DasGupta (1) in ch. 15 titled "U-statistics", r is a statistic's order (p. 225).

In sum, I don't understand how to find "r." I don't understand how the U1 and g1, and U2 and g2 equations interact algebraically. Lastly, under the null hypothesis for both U1 and U2, it looks like they have the standard normal distribution N(0,1); I don't understand what to do once I've come up with these numbers.

Any suggestions appreciated.

1-DasGupta, A. 2008. Asymptotic Theory of Statistics and Probability. Springer Texts in Statistics. New York, NY: Springer.

2-Mardia, K. V., and P. E. Jupp. 2000. Directional Statistics. Wiley Series in Probability and Statistics. Chichester, United Kingdom: John Wiley & Sons, LTD.

$\endgroup$

1 Answer 1

1
$\begingroup$

Let's separate out the questions.

I don't understand how to find "r."

Here, $r$ is just a temporary variable, denoting what goes into function $g_1(\cdot)$ or $g_2(\cdot)$. What goes into $g_1(\cdot)$ or $g_2(\cdot)$ is shown in the formula's for $U_1$ and $U_2$. So, for $U_1$, this would mean that we get $$g_1(3\bar{R}_1) = \sin^{-1} \left( \frac{3\bar{R}_1}{\sqrt{5}} \right),$$

etc. Just place whatever is passed to the function $g_1(\cdot)$ or $g_2(\cdot)$ in the respective function in place of $r$.

I don't understand how the U1 and g1, and U2 and g2 equations interact algebraically.

They don't, really. Because it is often difficult to find formulas for this kind of statistic that have exactly the distribution we want, the $U$-statistics are approximations. However, our approximation turns out to be much better if we use multiple regions for which we use different approximations. In practice, we can just select the one that is given for our current value for $R$, which will be the best approximation.

Lastly, under the null hypothesis for both U1 and U2, it looks like they have the standard normal distribution N(0,1); I don't understand what to do once I've come up with these numbers.

Because these test statistics have approximately the normal distribution, we can use our knowledge of the normal distribution to obtain a $p$-value. After obtaining some value for some $U$ (from $U_1$ or $U_2$), we can use the standard Normal CDF (Cumulative Distribution Function).

Calling this distribution function $F(\cdot)$, we would get the $p$-value for the one-tailed test that $\kappa_1 < \kappa_2$ from $F(U)$, the $p$-value for the one-tailed test that $\kappa_1 > \kappa_2$ from $F(-U)$, and a $p$-value for a two-tailed test from $2(1 - F(\vert U \vert)).$

In R, the standard Normal CDF is available as pnorm(), so we get:

pnorm(U) 
pnorm(-U) 

for the one-tailed tests, and

pnorm(abs(U), lower.tail=FALSE) * 2

for the two-tailed test.

$\endgroup$
4
  • $\begingroup$ Thank you @Kees-Mulder. Do you have any suggestion for what to do when the two samples being compared fit into different ranges? E.g., there is an F test for when R-bar >= .67, and the U-statistics listed above for the lower ranges/cases, so what if one sample is above the .67 threshold and another is in the middle range, etc.? $\endgroup$ Commented Nov 27, 2014 at 4:07
  • $\begingroup$ If the groups fall into different categories, I would suggest subtracting the mean for each group and obtaining the mean resultant length $\bar{R}$ for the total dataset. This is equal to taking the weighted average, so you can find the resultant length to use for choosing a test by $\bar{R}_{total} = \frac{n_1 \bar{R_1} + n_2 \bar{R_2}}{n_1 + n_2}.$ $\endgroup$ Commented Nov 27, 2014 at 9:11
  • $\begingroup$ Thank you again @kees-Mulder. That makes sense. Is there a reference I can use to explain that decision of using the weighted average for the test selection? $\endgroup$ Commented Nov 27, 2014 at 22:17
  • $\begingroup$ I don't know of any by heart but maybe Mardia says something about this when he first introduces a test which has two different test statistics for different values of $\bar{R}$. $\endgroup$ Commented Nov 28, 2014 at 9:17

Your Answer

By clicking “Post Your Answer”, you agree to our terms of service and acknowledge you have read our privacy policy.

Not the answer you're looking for? Browse other questions tagged or ask your own question.