3
$\begingroup$

Suppose this sample is generated from a $N(\mu, 9)$ distribution, $\mu$ is unknown. The question asks for a 95% confidence interval sample for $\mu$.

I think this is a pretty straightforward case of population mean estimate when $\sigma^2$ is known. So I use the following formula, where $\bar{x}=7, \sigma=3,$ and $n=4$

$\bar{X}_n-\frac{\sigma}{\sqrt{n}}z_{\alpha/2}< \mu <\bar{X}_n+\frac{\sigma}{\sqrt{n}}z_{\alpha/2}$

Can someone verify that my solution is correct? More generally, how do I interpret the resulting confidence interval?

$\endgroup$
4
  • $\begingroup$ It looks correct to me (what did you get for the endpoints?). Concerning the interpretation, a quick search on the site revealed many interesting posts. The Wikipedia page also has a section on the interpretation of confidence intervals. $\endgroup$ Commented Dec 12, 2014 at 7:31
  • $\begingroup$ @COOLSerdash, I was in process of making the same points when your comment came through. Maybe you could consider moving that response to an answer so the question does not add to the unanswered question stats? $\endgroup$
    – goangit
    Commented Dec 12, 2014 at 7:48
  • $\begingroup$ @COOLSerdash I agree with goangit, thanks for the help. Someone should write up an answer (and I will accept)! $\endgroup$
    – grayQuant
    Commented Dec 12, 2014 at 7:59
  • 4
    $\begingroup$ Your formula is fine, but it doesn't answer the question, which will consist of an interval defined by two numbers based on the observed data and the known standard deviation. $\endgroup$
    – Glen_b
    Commented Dec 12, 2014 at 8:33

1 Answer 1

3
$\begingroup$

The confidence interval you list is correct. Plugging your numbers in, I get a 95% confidence interval of $(4.06;\,9.94)$. Concerning the interpretation, a quick search on the site revealed many interesting posts. The Wikipedia page also has a section on the interpretation of confidence intervals.

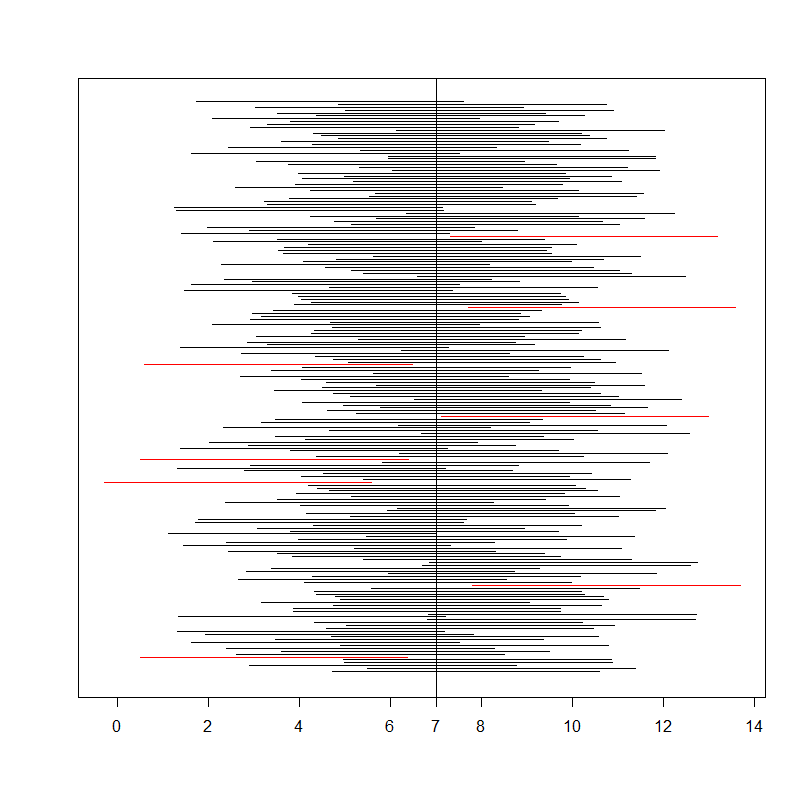
In short, there is not 95% probability that the above interval contains $\mu$ (the true mean). Rather, if you would calculate 100 95% confidence intervals in this way, 95% of them are expected to include $\mu$. But after you calculated your confidence interval, $\mu$ is either included or not.

Here is a small simulation in R to illustrate the procedure:

set.seed(123)
pop <- rnorm(1e7, mean = 7, sd = 3)

CI <- function(x, alpha = 0.05, true.sd) {  
  res <- c(mean(x) - qnorm(1-alpha/2)*(true.sd/sqrt(length(x)))
           , mean(x) + qnorm(1-alpha/2)*(true.sd/sqrt(length(x))))  
  res

}

n.sim <- 200
n <- 4

cis <- replicate(n.sim, CI(x = sample(pop, size = n, replace = TRUE), alpha = 0.05, true.sd = 3))

does.not.cover <- (cis[1, ] > 7) | (cis[2, ] < 7)

sum(does.not.cover)/n.sim

[1] 0.04

a <- min(cis[1, ])
b <- max(cis[2, ])
plot(0, 0, type = 'n', xlim = c(a, b), ylim = c(0, n.sim), ann = FALSE, yaxt = "n")
axis(1, at = 7, label = 7)
segments(cis[1, ], 1:n.sim, cis[2, ], 1:n.sim,
         col = ifelse(does.not.cover, 'red', 'black'))
abline(v = 7)
CI Simulation

I simulated 200 95% confidence intervals based on samples of $n=4$ from a population with mean $7$ and standard deviation $3$ (assumed to be known). 4% (i.e. 8) of the 200 95% confidence intervals don't contain the true mean of 7 (red segments in the picture). In the long run, the proportion of confidence intervals that don't contain the true mean is $\alpha$ (5% in this case).

$\endgroup$
4
  • $\begingroup$ The standard interpretation would be something like this: "We claim with 95% certainty that the true average $\mu$ is between 4.06 and 9.94." $\endgroup$
    – Michael M
    Commented Dec 12, 2014 at 8:46
  • 2
    $\begingroup$ @MichaelMayer that interpretation could be misleading (as COOLSerdash noticed), see e.g.: stats.stackexchange.com/questions/124113/… $\endgroup$
    – Tim
    Commented Dec 12, 2014 at 9:09
  • $\begingroup$ @Tim: That is of course right. But statistical reports would look quite funny when no abbreviations would be allowed. $\endgroup$
    – Michael M
    Commented Dec 12, 2014 at 9:35
  • $\begingroup$ @MichaelMayer but it is like you said that you are almost certainly sure (>99.99% sure) that your results are exactly right because you got $p<0.001$... That is a dangerous oversimplification. $\endgroup$
    – Tim
    Commented Dec 12, 2014 at 9:46

Your Answer

By clicking “Post Your Answer”, you agree to our terms of service and acknowledge you have read our privacy policy.

Not the answer you're looking for? Browse other questions tagged or ask your own question.