1
$\begingroup$

I have to collect and then analyse a large dataset. A particular data input (continuous variable) is laborious to collect and I believe that an ordinal category (1,2,3,4) would correlate closely with this continuous variable. I want to test this after collecting 10% of the data including the continuous variable, and provided there is a correlation, proceed to collect the other 90% of the data without collecting the continuous variable (simplifying my data collection greatly). At this stage I am not sure if the data will be normally distributed.

What is the appropriate statistical test to do this properly?

$\endgroup$
1
  • $\begingroup$ One of generally related questions on this site: stats.stackexchange.com/q/103253/3277. However, your specific question contains something that you didn't elucidate: I believe that an ordinal category (1,2,3,4) would correlate closely with this continuous variable. How are the four values initially related to the true values?, or, where did you pick those four values from? $\endgroup$
    – ttnphns
    Commented Jan 6, 2015 at 10:58

2 Answers 2

2
$\begingroup$

An appropriate test would be a rank correlation, like Spearman's rho or Kendall's tau. For instance, using R:

> ordinals <- rep(1:4,each=100)
> set.seed(1)
> continuous <- rnorm(length(ordinals),ordinals,1)
> cor.test(continuous,ordinals,method="kendall")

        Kendall's rank correlation tau

data:  continuous and ordinals
z = 16.3381, p-value < 2.2e-16
alternative hypothesis: true tau is not equal to 0
sample estimates:
     tau 
0.610561 

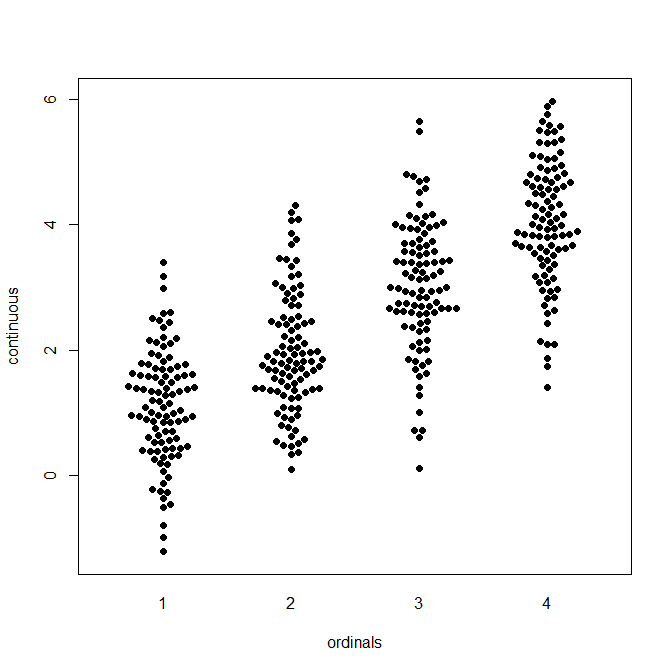
Nevertheless, I'd always recommend looking at plots of your data to get a visual impression of whether the relationship is "good enough". Scatterplots or beeswarm plots are better for this than boxplots, which lose too much information:

> require(beeswarm)
> beeswarm(continuous~ordinals,pch=19)

beeswarm

$\endgroup$
3
  • $\begingroup$ These are great data clouds, and they look like Christmas trees. But why did you say Kendall's tau is appropriate? Well, one certainly may use it if one of the two variables is interval, but at expense of treating it as ordinal. Pearson/Spearman comes to mind more easily because you could rank the ordinal one and leave as is the interval one, of the two variables. $\endgroup$
    – ttnphns
    Commented Jan 6, 2015 at 11:15
  • $\begingroup$ Some further comments: Whether the continuous variable is normally distributed is irrelevant here as the Spearman or other rank correlation Stephan reasonably recommends ignores everything but its ranks. Whether there is a non-zero correlation, the question answered by the significance test, should be less interesting than whether the ordinal variable is closely related enough to allow predictions of the continuous variable, or use of the ordinal variable as a proxy. The original post is vague on what is intended. $\endgroup$
    – Nick Cox
    Commented Jan 6, 2015 at 11:15
  • $\begingroup$ @ttnphns: point taken about Kendall. I'd answer that I would trust the plot and my eyes far more than any specific correlation measure or p-value to decide whether the association is "good enough" for whatever the OP wants to do later on. $\endgroup$ Commented Jan 6, 2015 at 11:25
2
$\begingroup$

I suggest Somers' $D_{xy}$ or $D_{yx}$ depending on which variable is $x$ and which is $y$. This will result in a concordance-based measure that does not penalize for ties in the 4-level variable and does penalize for any ties in the continuous variable. In R's Hmisc package the rcorr.cens function is one of probably many ways to get this, along with a standard error. If you want to penalize for ties in the 4-level ordinal variable then one of Kendall's $\tau$s or Spearman's $\rho$ may be appropriate.

$\endgroup$

Your Answer

By clicking “Post Your Answer”, you agree to our terms of service and acknowledge you have read our privacy policy.

Not the answer you're looking for? Browse other questions tagged or ask your own question.