8
$\begingroup$

I seem to recall one of my professors saying that error bars are completely uninformative when comparing repeated measures taken from a single group. Is that true?

Surely many studies compute the sample means for condition A and for condition B (i.e. levels A and B of a certain within-subjects factor), compare the means with a paired samples t-test, and then display them on a graph with error bars. Is this really wrong? If so, why?

$\endgroup$
1
  • 1
    $\begingroup$ Not quite a direct answer to your question, but there are a few different methods that are supposed to calculate meaningful error bars for within-subjects data, e.g. this method proposed by Cousineau and O'Brien. (apologies if this is not accessible, I'm on a university computer and can't tell if it's an open access article or just using my institutional access automatically) $\endgroup$
    – Marius
    Commented Jan 12, 2015 at 5:41

1 Answer 1

11
$\begingroup$

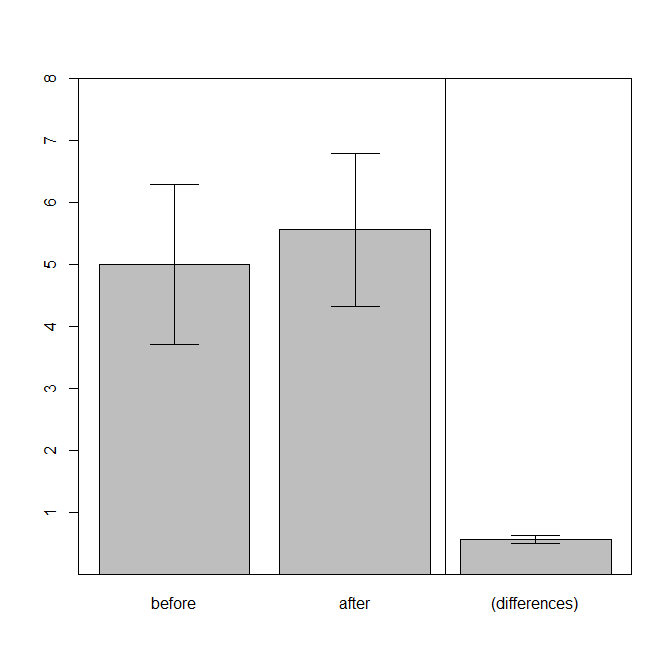
It isn't "wrong" necessarily, and it isn't "completely uninformative". But it provides information that pertains to a largely unrelated question, and so is likely to be misleading. When you run a paired samples $t$-test, you are really conducting a one-sample $t$-test of whether the mean of the differences is equal to $0$. Because this is a one-sample test, a corresponding figure would have one bar showing the mean difference (with error bars).

To see how this could be misleading, consider these data (coded with R):

set.seed(4868)  # this makes the example exactly reproducible (if you use R)
b = c(2, 4, 6, 8)
a = b + rnorm(4, mean=.5, sd=.1)
a = round(a, digits=3)
d = data.frame(before=b, after=a, differences=a-b)
d
#   before after differences
# 1      2 2.679       0.679
# 2      4 4.597       0.597
# 3      6 6.592       0.592
# 4      8 8.366       0.366
t.test(a, b, paired=T)
#  Paired t-test
# 
# data:  a and b
# t = 8.3117, df = 3, p-value = 0.003649
# alternative hypothesis: true difference in means is not equal to 0
# 95 percent confidence interval:
#   0.3446575 0.7723425
# sample estimates:
# mean of the differences 
#                  0.5585 

The $t$-test is highly significant. However, what impression would people get if you plotted the bars on the left vs. the bar on the right?
enter image description here

$\endgroup$
4
  • 1
    $\begingroup$ I see (I think). So the graph on the right would be the equivalent 1-sample t-test against zero, of the before-after difference? I'd say that "looks" significantly different from zero more than the two bars on the left look significantly different from each other in a paired sample test. However, I'm not sure I understand why adding the error bars for Before and for After, in order to show how variable the scores were across subjects, is misleading or is asking the wrong question.. $\endgroup$
    – z8080
    Commented Jan 11, 2015 at 20:21
  • 3
    $\begingroup$ @wildetudor, my point is that many people will look at the two bars on the left, & at their corresponding error bars, & think 'those don't differ'. So they would expect the t-test to be non-significant. They are sort-of right: the unpaired t-test would not be significant. But that only holds for the unpaired t-test, which isn't the appropriate test. When they heard 'the t-test was significant', they are likely to be confused. $\endgroup$ Commented Jan 11, 2015 at 20:26
  • $\begingroup$ And of course the correct t-test to use between those two bars (paired) would not be significant precisely because the two means are 'paired', i.e. they come from the same sample, and therefore for them to be significantly different they'd have to be much more apart than measures from two between-subjects condition. Is that right? But even then, I still don't understand why it is not informative to see the error bars, as long as you just want to see how variable subjects were in each condition as opposed to trying to 'eyeball' the results of the t-test. $\endgroup$
    – z8080
    Commented Jan 11, 2015 at 22:48
  • 3
    $\begingroup$ @wildetudor, I don't follow your question. The correct t-test here is significant. The existence of error bars leads people to believe that they can see whether the data are significant; that's generally the point. Having error bars that are appropriate for a different contrast than the one at issue will typically lead people astray. It's fine to have them, so long as you are extra clear that they do not relate to the primary analysis. You could also plot all 3, as I do above. $\endgroup$ Commented Jan 11, 2015 at 23:11

Your Answer

By clicking “Post Your Answer”, you agree to our terms of service and acknowledge you have read our privacy policy.

Not the answer you're looking for? Browse other questions tagged or ask your own question.