I'm working at a plant breeding company. During some spare time I recently did some exploring of our data (yield trials), mostly just out of curiosity and wanting to learn R better.
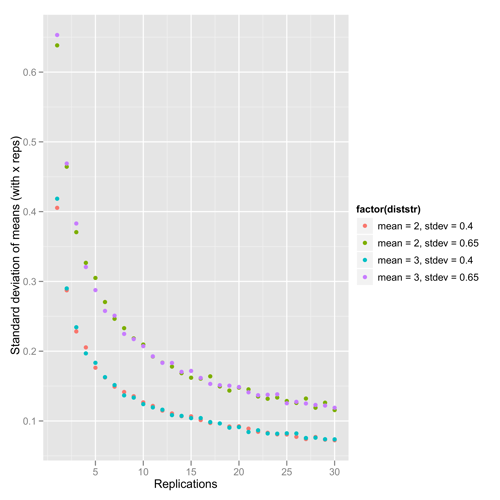
I started by plotting standard deviation of means created with different number of replications (in the actual data each color would represent a particular seed lot grown in a particular environment). Like this (examples are not actual yield data):

Figure 1. Standard deviation of means created from different number of normally distributed numbers.
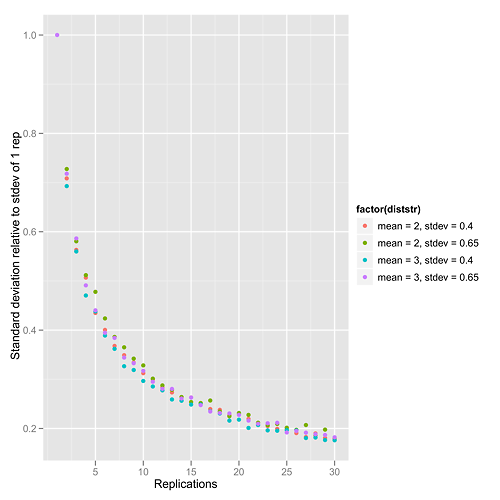
That looks perfectly understandable to me. I then got the idea to plot the standard deviation relative to the 1-rep standard deviation:

Figure 2. Standard deviation, relative to standard deviation in 1 rep, of means created from different number of normally distributed numbers.2
Obviously this relative standard deviation has a strong relationship with the number of replications. I have been thinking about it a while, but I'm having trouble to formulate the math behind this. So my question is this:
Can someone please explain to me, in mathematical terms, why we see the relationship visualized in the second figure?
(I have a feeling that the answer will leave me feeling utterly stupid for asking. I also realize that this may sound an awful lot like I'm trying to get you to do a homework assignment for me, but I'm really just curious and have access to loads of data but not a lot of training in statistics and mathematics. We have a statistician that I could have tried to ask, but he's on vacation.)
