5
$\begingroup$

I have some kind of disagreement with a groupmate. We have some data, and we have to fit a loglogistic distribution. Our highest data point is less than 14,000,000. The average of our data is 231,316.865 and standard deviation is 1,118,713.553.

E used Excel to estimate parameters of a loglogistic distribution (via MLE) and came up with shape=0.560983285656052, scale=4010.69503243576. I did it in R and came up with shape=1.667393, scale=8.294636.

I used Kolmogorov-Smirnov, and R didn't give a reason to say mine wasn't a good fit.

ks.test(b, "pllog", shape=1.667393, scale=8.294636)
        One-sample Kolmogorov-Smirnov test
data:  b
D = 0.0377, **p-value = 0.8836**
alternative hypothesis: two-sided
Warning message:
In ks.test(b, "pllog", shape = 1.667393, scale = 8.294636) :
  ties should not be present for the Kolmogorov-Smirnov test

As for h parameters...

ks.test(b, "pllog", shape=0.560983285656052, scale=4010.69503243576)
        One-sample Kolmogorov-Smirnov test
data:  b
D = 1, **p-value < 2.2e-16**
alternative hypothesis: two-sided
Warning message:
In ks.test(b, "pllog", shape = 0.560983285656052, scale = 4010.69503243576) :
  ties should not be present for the Kolmogorov-Smirnov test

I tried simulating values and this what I got with mine.

rllog(20, shape=1.667393, scale=8.294636)
 [1] 1.164583e+05 5.387827e+04 2.440876e+01 5.083744e+03 1.669974e+00
 [6] 1.125328e+05 3.781694e+02 5.572336e+04 2.352123e+03 4.060668e+03
[11] 2.597518e+02 1.068868e+02 4.695207e+03 7.780321e+03 5.787856e+03
[16] 2.196655e+04 2.933098e+04 1.253264e+06 1.196900e+03 5.399473e+02

This is what I got using h parameters. I notice if I start using scale=30, I get numbers in the 13 digits.

rllog(20, shape=0.560983285656052, scale=4010.69503243576)
 [1] Inf Inf Inf Inf Inf Inf Inf Inf Inf Inf Inf Inf Inf Inf Inf Inf Inf Inf Inf
[20] Inf
$\endgroup$
7
  • 3
    $\begingroup$ Couldn't you simply generate some data (so you'd know the parameters in advance) and check how well does the two software work for them? Simulation is a method of choice in this kind of problems. $\endgroup$
    – Tim
    Commented Feb 10, 2015 at 8:59
  • 1
    $\begingroup$ you should do simulation the other way: first generate values from a distribution with some parameters of your choice, and then use both R and Excel to estimate the parameters. Next, check the difference between the estimated parameters and their real values (that you know in advance!). $\endgroup$
    – Tim
    Commented Feb 10, 2015 at 9:14
  • 3
    $\begingroup$ For a particular data-set it's always good practice to plot the likelihood. $\endgroup$
    – Scortchi
    Commented Feb 10, 2015 at 15:47
  • 8
    $\begingroup$ Please notice that $\exp(8.294636) = 4002.346$ and $\exp(0.56098)=1.752389$ shows reasonably close agreement between Excel and R. As always, whenever using two or more computing platforms, you need to consult their documentation to make sure you are interpreting output correctly. $\endgroup$
    – whuber
    Commented Feb 10, 2015 at 16:25
  • 1
    $\begingroup$ @whuber: Looks like you've put your finger on it. Also $1/1.667393 = 0.5997386$. $\endgroup$
    – Scortchi
    Commented Feb 11, 2015 at 12:09

1 Answer 1

7
$\begingroup$

If $X$ has a logistic distribution with location parameter $\mu$ and scale parameter $\sigma$

$$\newcommand{\e}{\mathrm{e}}f(x) = \frac{\exp\left(\frac{x-\mu}{\sigma}\right)}{\sigma \left[1+ \exp\left(\frac{x-\mu}{\sigma}\right)\right]^2}$$

then $Y=\log(X)$ has a log-logistic distribution

$$f(y) = \frac{ \frac{\sigma^{-1}}{\e^\mu}\cdot \left(\frac{y}{\e^\mu}\right)^{\sigma^{-1}-1}}{\left[1 + \left(\frac{y}{\e^\mu}\right)^{\sigma^-1}\right]^2}$$

whose scale is not $\mu$ but $\e^\mu$. Though $\sigma$ might as well be called the shape, a common parametrization uses scale $\beta=\e^\mu$ & shape $\alpha=\sigma^{-1}$

$$f(y) = \frac{\frac{\alpha}{\beta}\cdot \left(\frac{y}{\beta}\right)^{\alpha-1}}{\left[1 + \left(\frac{y}{\beta}\right)^{\alpha}\right]^2}$$

You're certainly not reporting an estimate of scale, as that also estimates the distribution median & 8.29 seems far too low. If you're reporting $\hat\mu=8.294636$ and $\hat\sigma=1.667393$, then $\hat\alpha=0.59973$ & $\hat\beta=4002.3$; remarkably close to what your colleague is reporting.

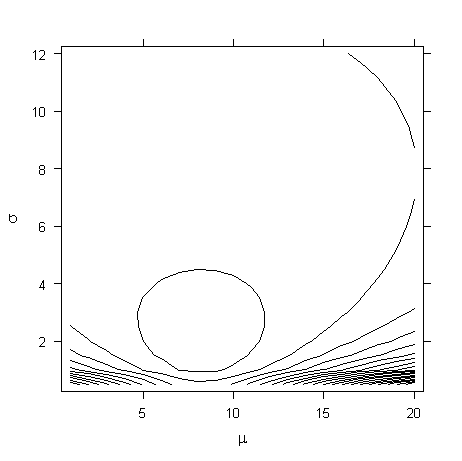
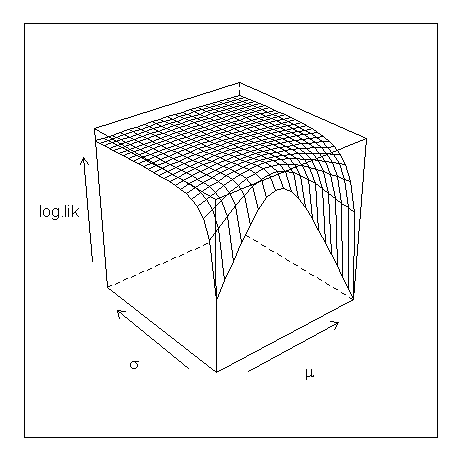
Plotting the likelihood is always a good idea. Here it is from a simulated sample, but you can use the real one:

contour plot of log-likelihood wire-frame plot of log-likelihood

You can see at a glance whether the maximum found by an algorithm is plausible.

† This is more detective work than Statistics (you should've included details in the question), but findFn (from the sos package) suggests that the pllog function you're using is from the FAdist package. The documentation is rather vague:—

If Y is a random variable distributed according to a logistic distribution (with location and scale parameters), then $X = exp(Y)$ has a log-logistic distribution with shape and scale parameters corresponding to the scale and location parameteres [sic] of Y, respectively.

"Corresponding to" gives the impression of having been chosen to avoid "equal to", but the code for pllog is

function (q, shape = 1, scale = 1, lower.tail = TRUE, log.p = FALSE) 
    {
        Fx <- plogis(log(q), location = scale, scale = shape)
        if (!lower.tail) 
        Fx <- 1 - Fx
        if (log.p) 
        Fx <- log(Fx)
        return(Fx)
    }

So if you're using the related dllog density function

function (x, shape = 1, scale = 1, log = FALSE) 
{
    fx <- dlogis(log(x), location = scale, scale = shape, log = FALSE)/x
    if (log) 
        return(log(fx))
    else return(fx)
}

to find the maximum-likelihood it will indeed be $\hat\mu$ & $\hat\sigma$ you're calling "scale" & "shape". More tenuously, if your colleague doesn't have a handbook of distributions sitting on their desk, they may well have have looked up the log-logistic distribution in Wikipedia, where it's parametrized with shape $\alpha$ & scale $\beta$. Mystery solved!

$\endgroup$
1
  • $\begingroup$ We realized it on our own. It was pretty dumb of me. Hahaha. To be fair, our prof never emphasized different parametrizations. E even gave a quiz without specifying a distribution so we guessed the probabilities based on the pdf we thought was right. $\endgroup$
    – BCLC
    Commented Feb 14, 2015 at 20:17

Your Answer

By clicking “Post Your Answer”, you agree to our terms of service and acknowledge you have read our privacy policy.

Not the answer you're looking for? Browse other questions tagged or ask your own question.