3
$\begingroup$

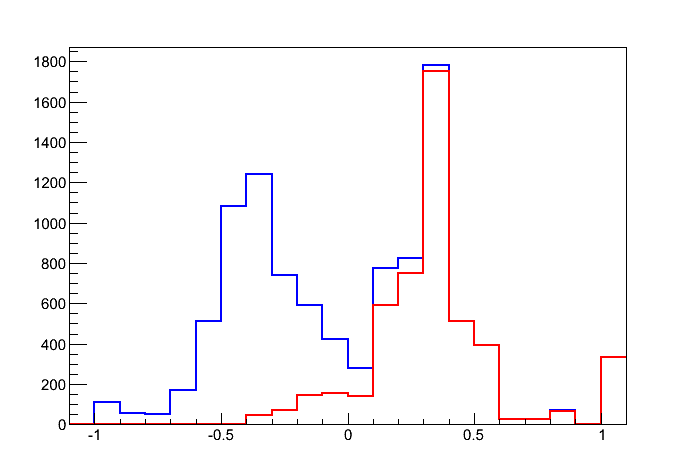
In high energy physics I know it is common task to find the best separation point between two classes of data, usually signal and noise. This separation point is usually determined by first binning the data, then making a decision based on maximizing the amount of signal while minimizing the amount of noise present on one side of the cut. For example, in the image below, blue might be signal, and red might be noise. You may hope for to set a cut that you'll expect in the future will have 70% signal on one side, and 30% noise. You may wish instead to get nearly all the signal, despite a large amount of noise. Then you'll set a cut that gets, say, 95% of the signal, but 60% of the noise.

It is important not to make a parametric assumption about the distribution that both the signal and the noise are considered samples from.

How does this procedure generalize to $N$ dimensions? How would a statistician approach this problem? Is there a principled or named way of doing so?

Below is an image I found on the web that depicts a one dimensional example of this scenario. One might choose to separate the red and blue data (make a cut) possibly at 0.1, or perhaps at 0.4. Maybe ignore the bit of blue showing in the 0.8 - 0.9 bin for this example!
From the web

$\endgroup$
4
  • $\begingroup$ Could you tell us what this separation point is supposed to mean? How would it be interpreted or used in further data analysis? $\endgroup$
    – whuber
    Commented Mar 2, 2015 at 20:56
  • $\begingroup$ It is to separate noise and signal. Say blue is signal, red is noise. Edited question $\endgroup$
    – bill_e
    Commented Mar 2, 2015 at 21:01
  • 1
    $\begingroup$ It is difficult to conceive of red as "noise" in this example: it looks like another signal. In a spectrograph like this people are typically interested in (a) quantifying the area under each separate peak, (b) determining whether a peak can be distinguished from a neighboring peak or underlying noise (of which there is very little apparent in this example), or (c) identifying a threshold used to discriminate one signal from the other (such as blue vs. red). Only the latter actually needs a "separation point" to be identified. That's why I am inquiring as to your objectives. $\endgroup$
    – whuber
    Commented Mar 2, 2015 at 21:04
  • 1
    $\begingroup$ (C) is exactly what I am asking about. $\endgroup$
    – bill_e
    Commented Mar 2, 2015 at 21:07

1 Answer 1

2
$\begingroup$

I work with machine learning algorithms, so I can only tell you how I would approach the problem. If I had access to labeled data (like the blue/red data points in your example), I would employ a linear C-SVM, which:

  1. is non-parametric (except for a mis-classification/regularization parameter 'C')
  2. attempts to solve the problem of separating labeled data using a 'maximum margin' line/plane in N dimensions
  3. allows for unequal class distributions (achieved by varying 'C' proportional to the inverse of class membership)

I apologize if you are already aware of this class of algorithms...

$\endgroup$

Your Answer

By clicking “Post Your Answer”, you agree to our terms of service and acknowledge you have read our privacy policy.

Not the answer you're looking for? Browse other questions tagged or ask your own question.