3
$\begingroup$

Here is a summary of my actual data

> summary(data_licor_sub)
              Date    Block     Tree.ID                  Cross       Rank         Log.ID     
 Fri Aug 29 2014:24   1:96   17578  : 32   180-1 x MAX1     :56   short:160   Min.   : 1.00  
 Thr Aug 28 2014:80   2:94   17786  : 32   288-5 x MAX3     :46   tall :150   1st Qu.:18.00  
 Tue Aug 26 2014:80   3:96   17844  : 32   D125 x K1        :64               Median :36.00  
 Tue Sep  2 2014:40   4:24   17544  : 24   SO443WL x SO479WL:48               Mean   :38.35  
 Wed Aug 27 2014:86          17757  : 24   SO450WL x SO465WL:48               3rd Qu.:57.75  
                             17961  : 24   SO459WL x SO469WL:48               Max.   :86.00  
                             (Other):142                                                     
      HHMMSS        FTime             EBal.       Photo             Cond         Temp.group
 10:10:12:  1   Min.   :  275.5   Min.   :0   Min.   :-9.905   Min.   :0.07728   30:154    
 10:10:15:  1   1st Qu.: 6102.2   1st Qu.:0   1st Qu.:-5.320   1st Qu.:0.17907   35:156    
 10:12:51:  1   Median : 9855.5   Median :0   Median :11.233   Median :0.23381             
 10:12:54:  1   Mean   : 9529.0   Mean   :0   Mean   : 7.545   Mean   :0.26349             
 10:26:29:  1   3rd Qu.:13077.2   3rd Qu.:0   3rd Qu.:19.671   3rd Qu.:0.31512             
 10:26:32:  1   Max.   :18499.0   Max.   :0   Max.   :28.378   Max.   :1.01373             
 (Other) :304                                                                              
      Tair           Tleaf       Light.Dark     Cond.log       
 Min.   :26.40   Min.   :28.18   Dark :154   Min.   :-3.69372  
 1st Qu.:29.54   1st Qu.:29.46   Light:156   1st Qu.:-2.48140  
 Median :35.28   Median :31.96               Median :-2.09658  
 Mean   :34.64   Mean   :32.14               Mean   :-2.07202  
 3rd Qu.:39.23   3rd Qu.:34.90               3rd Qu.:-1.66605  
 Max.   :41.57   Max.   :36.11               Max.   : 0.01967  

Basically i am interested to see how the photosynthesis & conductance (respiration) varies for genotype (Tree.ID), family (Cross), height (Rank) and temperature (Temp.group).

Before doing any analysis, i tried to check for normality of my two variable (Photo/Cond), i found that they are not normal (i am only showing "Cond" here) and because of that i have decided to transform that data using Box-cox transformation. Even though the transformation worked really well, it changed my anova result.

Here is my initial anova regression result

> r1 <- aov(Cond ~ Temp.group + Cross + Rank + Tree.ID, data_licor_sub)

> summary(r1)
             Df Sum Sq Mean Sq F value   Pr(>F)    
Temp.group    1 0.3971  0.3971  39.755 1.04e-09 ***
Cross         5 1.1798  0.2360  23.624  < 2e-16 ***
Rank          1 0.0082  0.0082   0.824    0.365    
Tree.ID       5 0.7318  0.1464  14.653 7.61e-13 ***
Residuals   297 2.9665  0.0100                     

However after transforming the box-cox transformation using an appropriate lambda, this is what i get

> r2 <- aov(Cond^-0.18181818 ~ Temp.group + Cross + Rank + Tree.ID, data_licor_sub)
> summary(r2)
             Df Sum Sq Mean Sq F value   Pr(>F)    
Temp.group    1 0.3106 0.31063  59.045 2.26e-13 ***
Cross         5 1.1012 0.22023  41.863  < 2e-16 ***
Rank          1 0.0324 0.03237   6.153   0.0137 *  
Tree.ID       5 0.4203 0.08406  15.978 6.05e-14 ***
Residuals   297 1.5625 0.00526                     

As you can see the variable "Rank" was non significant before but now it became significant after transformation. Am i missing some thing?

Here is a plot that shows before and after transformation to indicate the transformation worked great
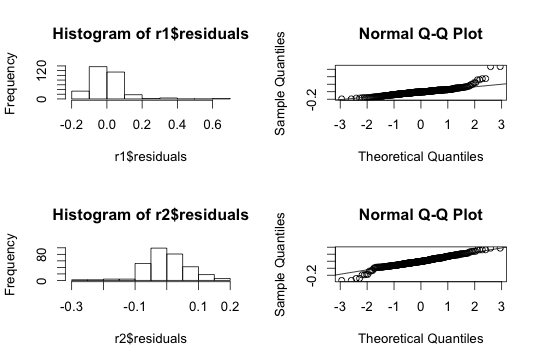
Box-Cox transformation result

I also did log-transformation based on comment from one of the person and here is the result. Looks more or less same as box-cox transformation.

> r3 <- aov(Cond.log ~ Temp.group + Cross + Rank + Tree.ID, data_licor_sub)
> summary(r3)
             Df Sum Sq Mean Sq F value   Pr(>F)    
Temp.group    1  11.52  11.520  57.802 3.83e-13 ***
Cross         5  40.30   8.061  40.444  < 2e-16 ***
Rank          1   1.08   1.082   5.427   0.0205 *  
Tree.ID       5  16.34   3.269  16.401 2.71e-14 ***
Residuals   297  59.19   0.199                     
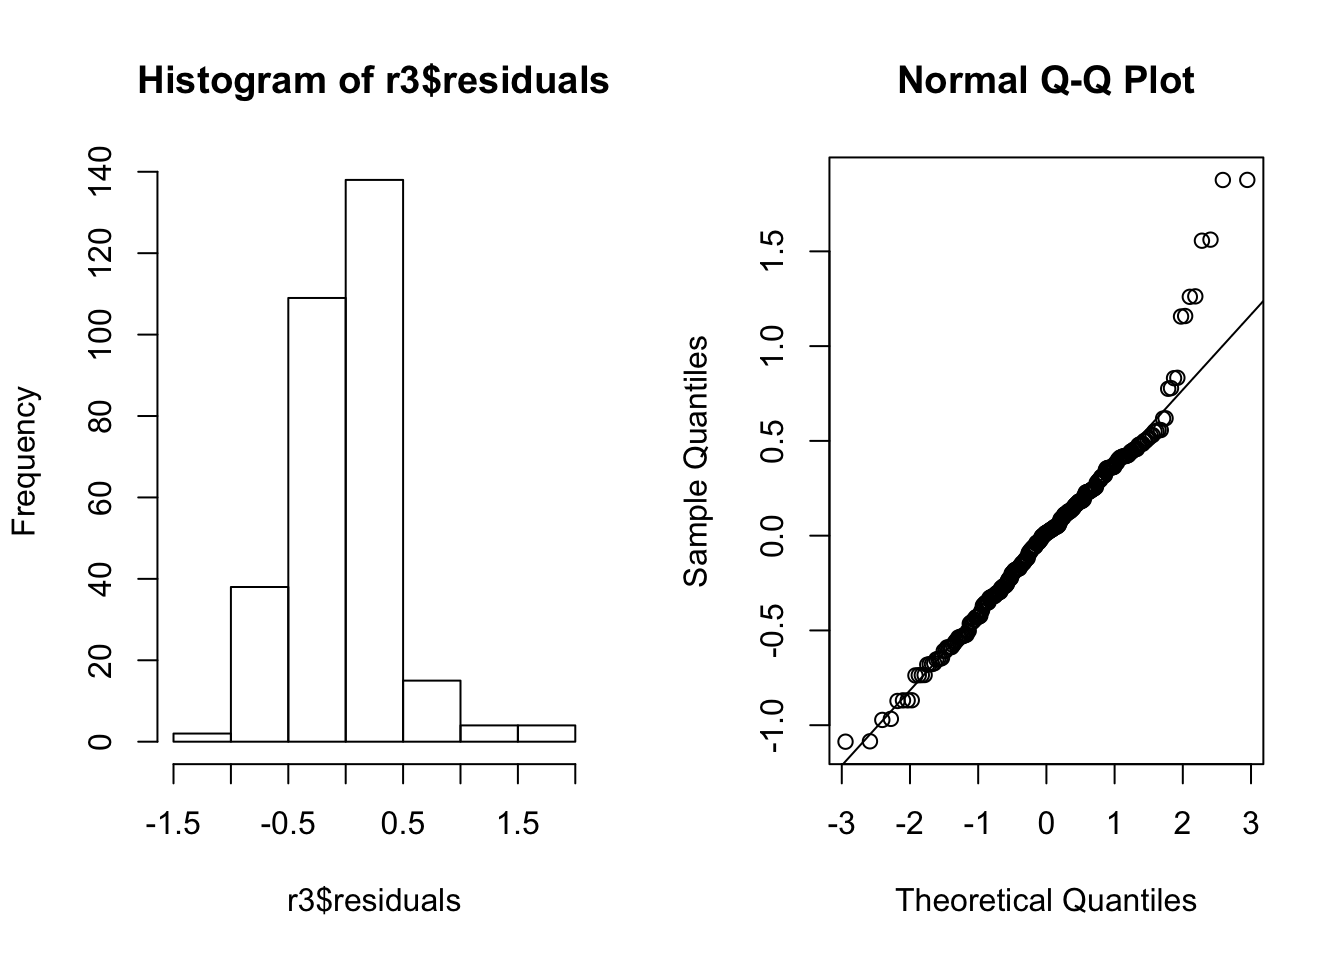
Log transformation

$\endgroup$
9
  • 6
    $\begingroup$ Some things to think about: If a transformation did not change the results, why would anyone want to apply it in the first place? And if you feel the transformation was called for by the nature of the data, how relevant would that make the results obtained with the untransformed data anyway? $\endgroup$
    – whuber
    Commented Mar 27, 2015 at 1:09
  • 3
    $\begingroup$ "Even though the transformation worked really well, it changed my anova result." -- of course it did, you changed the data! I'm not sure why you'd think that the second made more sense than the first, though - the original results look reasonable. What sense is there in a power of -2/11? If I was going to do Box Cox, and for some reason a power like that came up, I'd just use logs. $\endgroup$
    – Glen_b
    Commented Mar 27, 2015 at 7:14
  • 3
    $\begingroup$ The log function is merely a special case of a Box-Cox transformation, so it's not a choice between two options. I presume you called an actual R function to estimate the Box-Cox transformation, but even if a transformation is a good idea (and frequently other things than transformation are good choices), you shouldn't necessarily just pick the estimate from a function. Ideally you use a nearby value where the transformation is easy to interpret. ...(ctd) $\endgroup$
    – Glen_b
    Commented Mar 28, 2015 at 0:24
  • 3
    $\begingroup$ (ctd)...(Often subject area knowledge will suggest good choices for such values, but even where that's absent, often values like square root, log, reciprocal and reciprocal-square-root may be readily understood and even be meaningful in the original context.) $\endgroup$
    – Glen_b
    Commented Mar 28, 2015 at 0:24
  • 2
    $\begingroup$ Well, -.18181818 would be -2/11 (indeed, the value could well be -2/11 stored as a floating point number, since it was probably evaluated on a grid) but -2/11 isn't "readily interpretable" in the intended sense. I mean "round -.181818 to the nearest interpretable value, which is 0" and my comments also suggest that you should first consider whether you really need to use transformation rather than some other possibility, and if you do transform, you should consider what values would be meaningful for the particular variable you're transforming ... (ctd) $\endgroup$
    – Glen_b
    Commented Mar 28, 2015 at 1:04

1 Answer 1

4
$\begingroup$

First, unrelated to the question you asked, I’m not sure why you are running an ANOVA on your linear regression model. Some clarification about your variables and your goals for running this analysis might be helpful to those trying to help with your issue.

Second, to me personally it is not surprising that you are getting different results after the transformation. Remember the purpose for doing the transformation in the first place. Both ANOVA and linear regression are parametric tests, and one of the several assumptions that must be met for parametric tests is that the data distribution must be normal. The goal of transformation is to accomplish this task of normalizing the distribution. Sometimes normalization will kick out significant results, sometimes it will not change the results, and in your case, sometimes it will bring results into significance. I have had all of these happen in my own transformations. Field (Discovering Statistics Using R, 4th, 2012, p. 193), has a good review of the purpose and debate about transforming data. He points out that especially in the case of ANOVA, transforming data can be problematic, and recommends carefully understanding why and how you are transforming the variables, in addition to exploring robust methods (see below) instead of transforming the data in some circumstances. I highly recommend his very brief review of this issue, in which he refers to several articles on this topic, such as Games, 1984, Psychological Bulletin 95(2): 345-47, "Data transformations, power, and skew A rebuttal to Levine and Dunlap."

Third, if you are actually using different groups (a presumption for ANOVA), then you should really be making sure that each group is normally distributed not just the entirety of the dataset. You may be doing this already—but if so, the information you provide doesn’t make that clear. (Field p. 412: “In terms of normality, what matters is that distribution within groups are normally distributed”). This of course assumes that you are also satisfying all of the other across-data, and within-group tests, such as homogeneity of variance, etc. which were not shown above.

Fourth, you might consider robust tests (Field, p. 441+) instead of transformations. For example, the R package “robust” or command "rlm".

$\endgroup$
6
  • $\begingroup$ thanks a lot for your helpful comments and suggestions. Basically i am looking to see how the temperature, family, rank and genotype of the tree effects the respiration trait. I am not sure how i can check the distribution of dependant varaiable - Temp.group (35 & 45), family (6 families), rank (short and tall) and genotype (2 genotypes per family) since they are categorical. Can you throw some light on it... $\endgroup$
    – upendra
    Commented Mar 27, 2015 at 19:47
  • $\begingroup$ you mean Manova? I have tried that too and i got the same result as earlier with ANOVA $\endgroup$
    – upendra
    Commented Mar 27, 2015 at 23:10
  • 1
    $\begingroup$ Sorry--I made a comment earlier, but deleted it. I had referred originally to "multiple" anova, which is different from manova--the latter is called "multivariate" anova, which refers to having 2+ "dependent" variables--if "COND" or the respiration is your only dependent variable, then you would not use MANOVA. "Multiple" ANOVA uses 2+ "independent" variables, which is what you are showing us above. They are different commands in R: MANOVA actually uses "manova" while multiple anova simply uses "aov" statmethods.net/stats/anova.html $\endgroup$ Commented Mar 27, 2015 at 23:35
  • 1
    $\begingroup$ Ah--I reread your post now that you have edited it--it does look like you are using two dependent variables--conductance and photosynthesis. If you are testing them separately, with each of your independent variables, it's still just multiple ANOVA, and the "aov" commend, but if you want to test them together, then it becomes a MANOVA test $\endgroup$ Commented Mar 27, 2015 at 23:38
  • $\begingroup$ townslay - thanks again for your help. I did the multiple anova and i did not find any difference between the lm + anova and multiple anova. Am i interpreting wrong here? Anyway i have edited my post again and now it make better read. Any further comments on this? Can i assume log-transformation is ok for my data? $\endgroup$
    – upendra
    Commented Mar 28, 2015 at 0:21

Your Answer

By clicking “Post Your Answer”, you agree to our terms of service and acknowledge you have read our privacy policy.

Not the answer you're looking for? Browse other questions tagged or ask your own question.