3
$\begingroup$

It is said that K-means clustering "does not work well with non-globular clusters."

However, is this a hard-and-fast rule - or is it that it does not often work?

I have a 2-d data set (specifically depth of coverage and breadth of coverage of genome sequencing reads across different genomic regions cf. bioinformatics). In short, I am expecting two clear groups from this dataset (with notably different depth of coverage and breadth of coverage) and by defining the two groups I can avoid having to make an arbitrary cut-off between them.

The procedure appears to successfully identify the two expected groupings, however the clusters are clearly not globular. Is this a valid application? I am not sure whether I am violating any assumptions (if there are any?), or whether it is just that k-means often does not work with non-spherical data clusters.

If the question being asked is, is there a depth and breadth of coverage associated with each group which means the data can be partitioned such that the means of the members of the groups are closer for the two parameters to members within the same group than between groups, then the answer appears to be yes. But is it valid? Or is it simply, if it works, then it's ok?

(Apologies, I am very much a stats novice.)

Edit: below is a visual of the clusters. The breadth of coverage is 0 to 100 % of the region being considered. The depth is 0 to infinity (I have log transformed this parameter as some regions of the genome are repetitive, so reads from other areas of the genome may map to it resulting in very high depth - again, please correct me if this is not the way to go in a statistical sense prior to clustering).
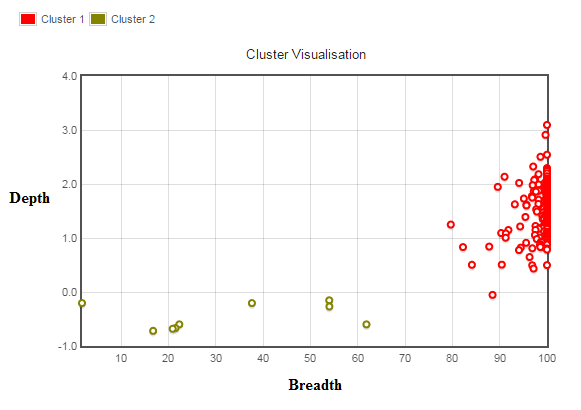
Clusters (breadth/depth of coverage

As you can see the red cluster is now reasonably compact thanks to the log transform, however the yellow (gold?) cluster is not. Despite this, without going into detail the two groups make biological sense (both given their resulting members and the fact that you would expect two distinct groups prior to the test), so given that the result of clustering maximizes the between group variance, surely this is the best place to make the cut-off between those tending towards zero coverage (will never be exactly zero due to incorrect mapping of reads) and those with distinctly higher breadth/depth of coverage. The algorithm converges very quickly <10 iterations.

Thanks, Jon.

$\endgroup$
4
  • $\begingroup$ If the clusters are clear, well separated, k-means will often discover them even if they are not globular. But if the non-globular clusters are tight to each other - than no, k-means is likely to produce globular false clusters. $\endgroup$
    – ttnphns
    Commented Apr 4, 2015 at 7:27
  • $\begingroup$ Thanks, I have updated my question include a graph of clusters - do you think these clusters(?) are reasonably separated? $\endgroup$
    – meld24
    Commented Apr 4, 2015 at 13:18
  • $\begingroup$ Well, the muddy colour points are scarce. They are not persuasive as one cluster. $\endgroup$
    – ttnphns
    Commented Apr 4, 2015 at 13:40
  • $\begingroup$ But, under the assumption that there must be two groups, is it reasonable to partition the data into the two clusters on the basis that they are more closely related to each other than to members of the other group? In fact you would expect the muddy colour group to have fewer members as most regions of the genome would be covered by reads (but does this suggest a different statistical approach should be taken - if so.. I am not sure which one?) $\endgroup$
    – meld24
    Commented Apr 4, 2015 at 13:46

2 Answers 2

2
$\begingroup$

K-means will not perform well when groups are grossly non-spherical. I highly recomend this answer by David Robinson to get a better intuitive understanding of this and the other assumptions of k-means.

K-means does not perform well when the groups are grossly non-spherical because k-means will tend to pick spherical groups. Tends is the key word and if the non-spherical results look fine to you and make sense then it looks like the clustering algorithm did a good job. What matters most with any method you chose is that it works.

$\endgroup$
2
  • $\begingroup$ Thanks, this is very helpful. I have read David Robinson's post and it is also very useful. I have updated my question to include a graph of the clusters - it would be great if you could comment on whether the clustering seems reasonable. $\endgroup$
    – meld24
    Commented Apr 4, 2015 at 13:17
  • $\begingroup$ It certainly seems reasonable to me. Let's put it this way, if you were to see that scatterplot pre-clustering how would you split the data into two groups? I would split it exactly where k-means split it. $\endgroup$ Commented Apr 4, 2015 at 15:18
1
$\begingroup$

I would rather go for Gaussian Mixtures Models, you can think of it like multiple Gaussian distribution based on probabilistic approach, you still need to define the K parameter though, the GMMS handle non-spherical shaped data as well as other forms, here is an example using scikit: https://jakevdp.github.io/PythonDataScienceHandbook/05.12-gaussian-mixtures.html

P.S. it's been a years for this question, but hope someone find this answer useful.

$\endgroup$

Your Answer

By clicking “Post Your Answer”, you agree to our terms of service and acknowledge you have read our privacy policy.

Not the answer you're looking for? Browse other questions tagged or ask your own question.