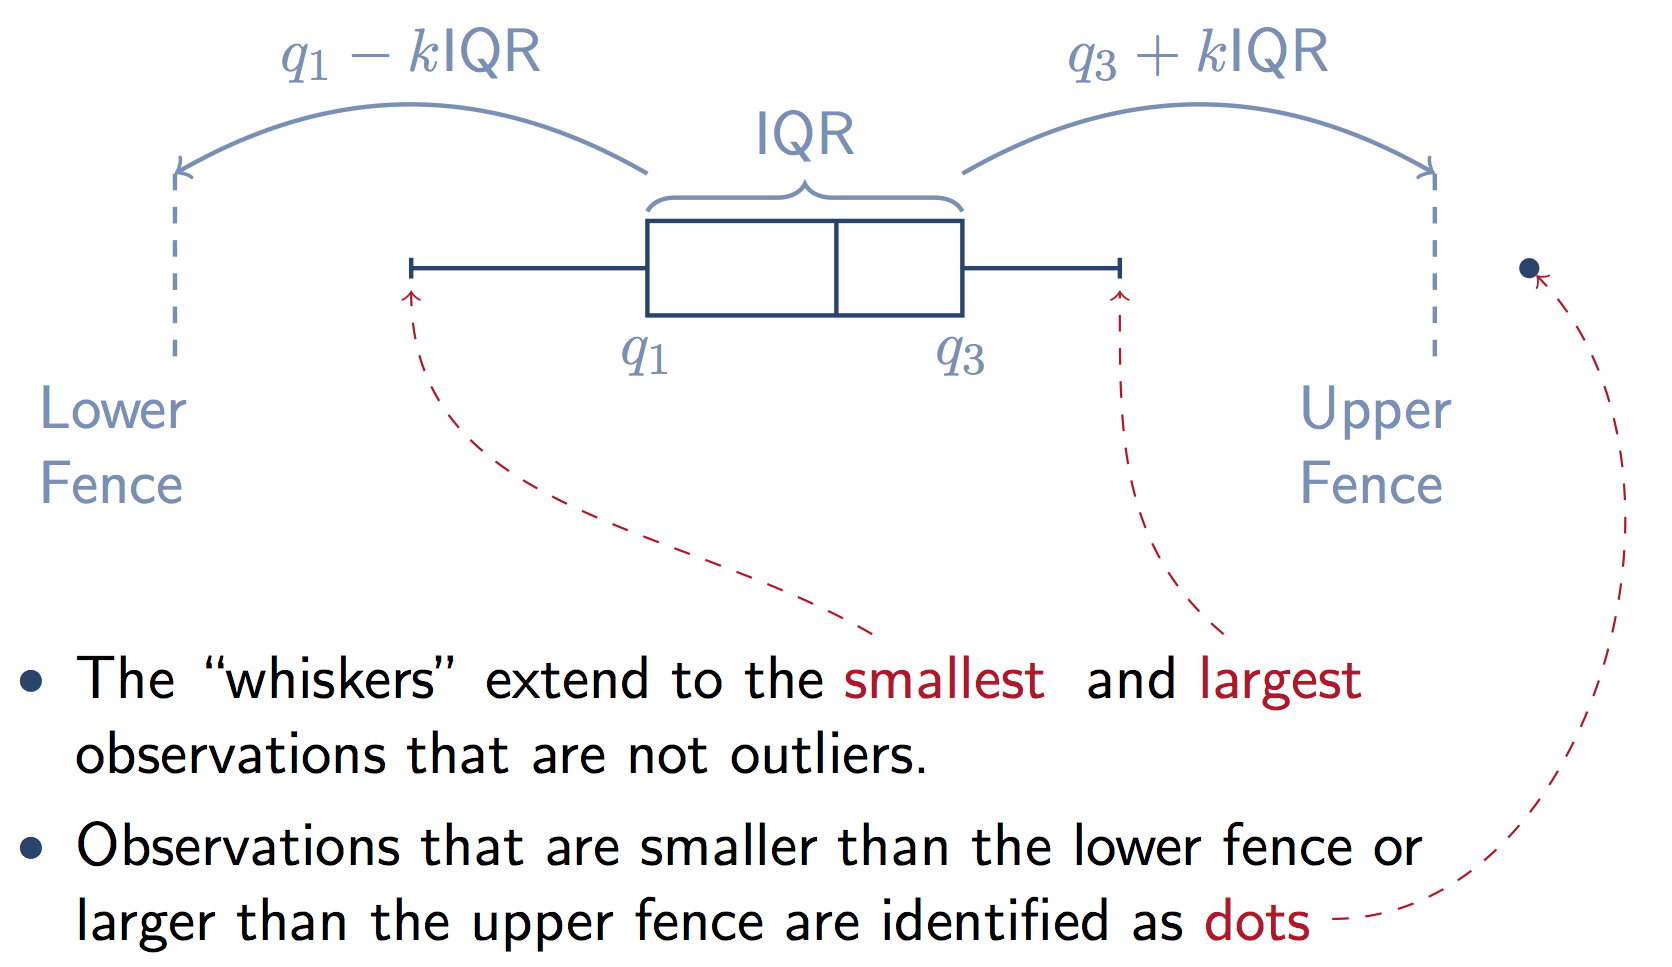
In one type of box-whisker plot, the fences at the ends of the whiskers are meant to indicate cutoff values beyond which any point would be considered an outlier.
The standard definitions I've found for these cutoff values are
$$ q_1 - k \times \mathrm{IQR} $$ for the lower fence, and $$ q_3 + k \times \mathrm{IQR} $$ for the upper one, where $q_1$ and $q_3$ are the first and third quartile, respectively, $\mathrm{IQR} := q_3 - q_1$ is the interquartile range, and $k$ is some constant $ > 0$. (The value of $k$ I've seen most often is 1.5, with 3 being a distant second.)
So far so good.
The problem is that, with these definitions, the distance between the lower fence and $q_1$ would always be the same as the distance between the upper fence and $q_3$, namely $k\times \mathrm{IQR}$. IOW, the length of the upper whisker would always equal the length of the lower one 1.
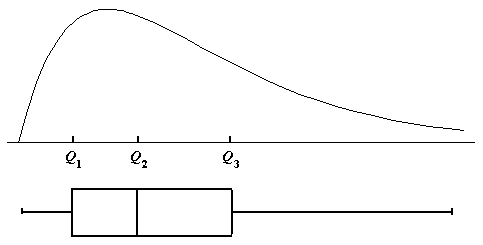
This does not agree with the vast majority of BW plots I see out there. Of course, for some of these plots the ends of the whiskers are supposed to represent the min and max values, so the comments above do not apply to them. But there are many other cases in which the fences are meant to denote the criterion for classifying points as outliers, and are supposedly based on formulae like the ones shown above, but nonetheless the resulting whiskers have different lengths. (For example.)
What am I missing?
1 By "length of the upper/lower whisker" I mean, of course, the distance between the point where the whisker meets the box and the whisker's "free" end-point.


