7
$\begingroup$

I use a Cox proportional hazard model (coxph()) which gives me HR of about 2.9 for presence of factor B (factors can be A, B, C, A as baseline in the model), with 95% CI 1.8-4.8 , p<0.001.

When checking the proportionality assumption there is significant evidence that there is a violation of that assumption.

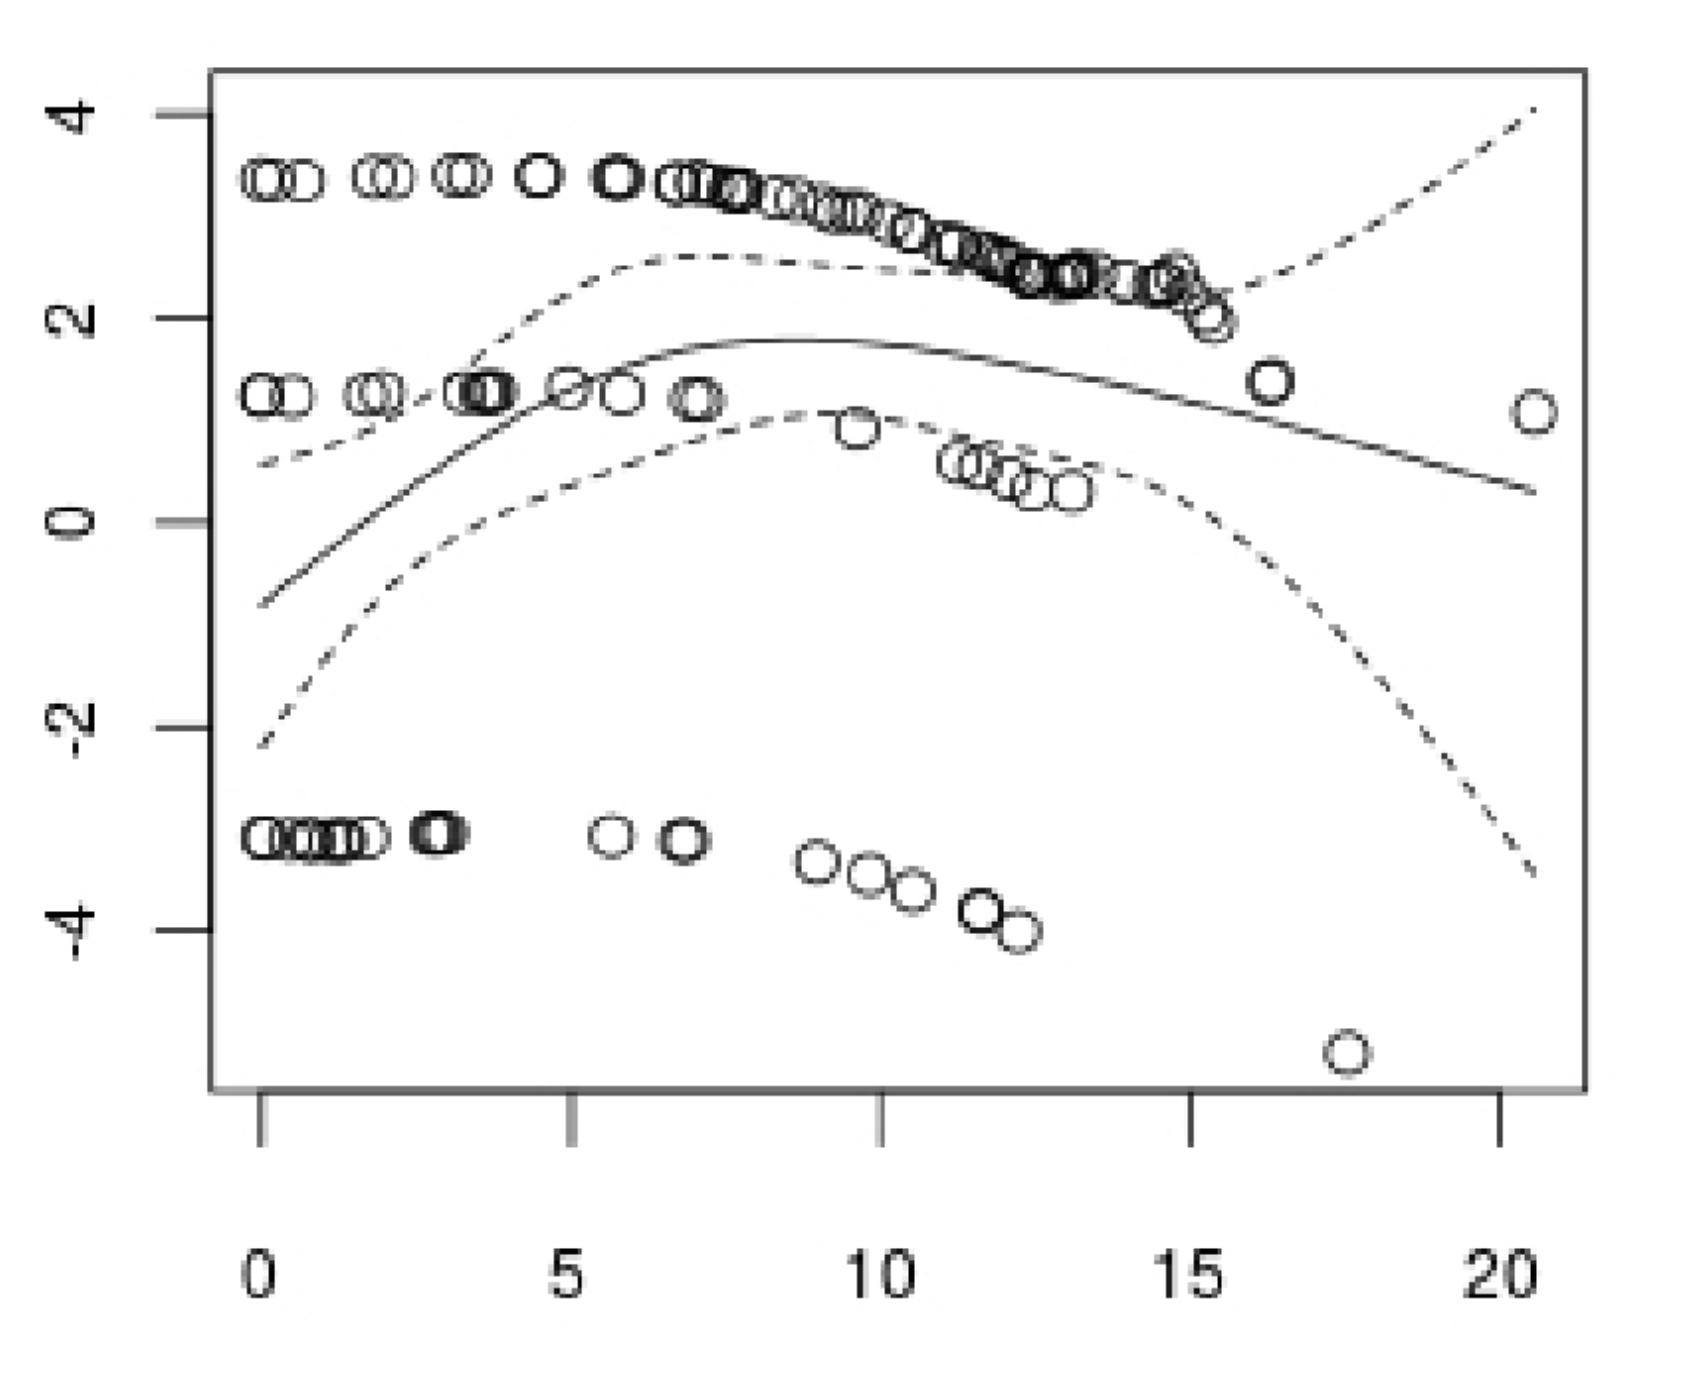
Result of plot(cox.zph) for the model with factor A is shown below.

enter image description here

My question is how should I understand the smoothing line of the graph, and what is its relation (and the relation of the values on the y-axis) to the beta estimate the coxph() function gives me (2.9 for the above example)?

If there was no violation and the line of the cox.zph plot was straight, would the y-value of the line be (in this example) log(2.9)=0.46? If there is no violation of the proportionality assumption, does the "intercept" of the line equal the log of the HR that coxph() outputs?

$\endgroup$
2

2 Answers 2

4
$\begingroup$

When interpreting the output of cox.zph it is just as much (or even more) the "flatness" of the line, as it is the straightness of the line, that is important. If the line is straight but slanted upward it implies non-proportionality in the form of a rising hazard ratio over time. See Therneau and Gramsch's text in their chapter on "Functional Form".

Regarding the values ... the estimation and inferences are all on the log-hazard scale and the estimates are NOT about the estimated effect but rather about the residuals’ deviation from the estimated effect. The mean value of the residuals should be zero. That’s the whole point of the calculations.

$\endgroup$
2
$\begingroup$

The curve is a natural spline fit (by default, with 4 degrees of freedom) of the time varying estimates of beta (the log of the hazard ratio). If that line is fairly flat and straight, then proportionality is supported. The dashed lines are confidence intervals at two standard errors. See the help pages for cox.zph and plot.cox.zph for some more information.

$\endgroup$
5
  • $\begingroup$ thanks but i have already done this. I think my question is, IF theoretically the line was straight, would the y-value of the line be (in this example) log(2.9)=0.46? If there is no violation of the proportionality assumption, does the "intercept" of the line equal the log of the HR that the coxph outputs? $\endgroup$
    – user6143
    Commented Sep 2, 2011 at 16:39
  • $\begingroup$ I believe so, but the line would be at ln(2.9)=1.06 (natural log, not base 10 log). $\endgroup$ Commented Sep 2, 2011 at 17:20
  • $\begingroup$ In the context of R/S+ programming, which this clearly is, your advice about using ln instead of log is misleading. $\endgroup$
    – DWin
    Commented Feb 8, 2012 at 22:13
  • 1
    $\begingroup$ @DWin, in terms of code, you are correct; I probably should not have marked that up as code. I was using $\ln$ as a base $e$ logarithm in contrast to $\log$ as a base 10 logarithm. In R, the mathematical function $\ln$ is log(). So it should either have been $\ln(2.9)=1.06$ or log(2.9) which gives [1] 1.064711 $\endgroup$ Commented Feb 10, 2012 at 15:16
  • $\begingroup$ The answer to the first comment is a flat “no”. There is really not any information in that plot about the estimated HR. It’s all about the discrepancy between the estimates and the observed values. $\endgroup$
    – DWin
    Commented Jul 13 at 14:46

Your Answer

By clicking “Post Your Answer”, you agree to our terms of service and acknowledge you have read our privacy policy.

Not the answer you're looking for? Browse other questions tagged or ask your own question.