3
$\begingroup$

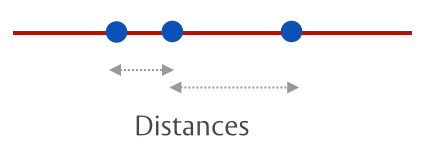
I have a set of experimental data which comprises distances between successive points:
enter image description here

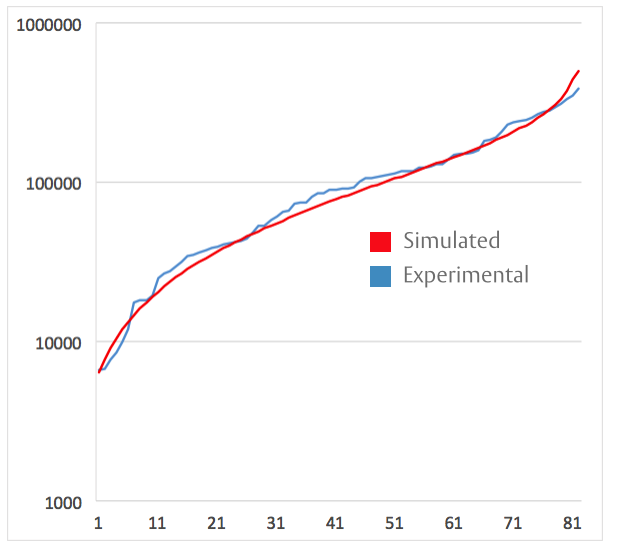
And a simulation which attempts to recapture the experimental data by choosing points at random and calculating the distances between them. This is repeated many times as to create a population of simulations. The red line below shows the simulated population average:
enter image description here

x-axis = No. of Distances (plotted in increasing size)
y-axis (logarithmic) = Distance size

Neither the experimental data nor the simulated data fits a normal distribution (as assessed by the one-sample Kolmogorov–Smirnov test). Given the nature of the data i.e. distances between successive points and visual inspection of the data, a gamma-distribution appears to best fit the data.

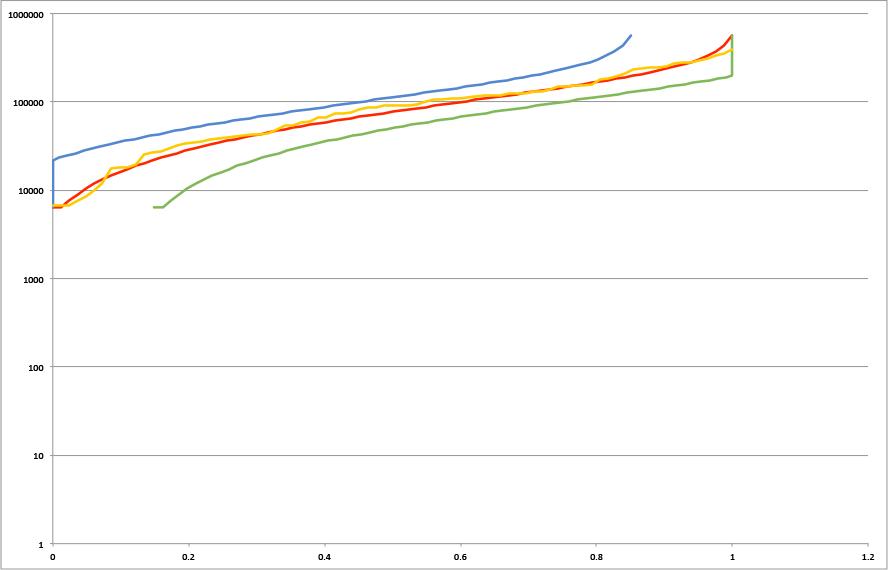
I need to be able to calculate by how much any given simulation can deviate from the mean such that I can place two lines either side of the population average and show whether or not the experimental data (blue line) falls within this range. This is largely because the experimental data is NOT population based and represents a single sample.

As the 68–95–99.7 rule does not apply here - is there any more precise method than using Chebyshev's inequality and -/+ 2-3SD? This produces a rather wide band that makes it difficult to assess changes in the simulation parameters.

EDIT:
enter image description here

$\endgroup$

1 Answer 1

1
$\begingroup$

If you are able to assume a distribution for your population, than you can invert the KS test in order to build a confidence band around the cumulative function of the population which will contain your estimation with a given confidence level.

Starting with formula for the statistic used in KS test $$ D_n = \sup_x | F_n(x) - F(x) | $$ and knowing that the goodness of fit is built using critical values of Kolmogorov distribution you have $$ \sqrt{n}D_n > K_\alpha$$ Now by choosing your alpha you are able to determine $K_\alpha$ such that $$ P(K<K_\alpha) = 1-\alpha$$ So you can determine some quantity $D_\alpha$ such that $P(D_n>D_\alpha)=\alpha$ and use that as a width around the graph of $F(x)$.

See more details on KS test wiki page, section named "Setting confidence limits for the shape of a distribution function".

$\endgroup$
3
  • $\begingroup$ Great. I've calculated values of f(x) and then adjusted (x) +/- d calculated as 1.36/SQRT(n) for 95% confidence. This produces a surprisingly wide band (see OP edit). Is this due to a low sample level (n=83) or have I done this incorrectly? I've done all calculations on the population average. $\endgroup$ Commented Jul 7, 2015 at 10:31
  • $\begingroup$ Obviously the numbers depends on the sample size. Basically, the KS tests statistic works when n goes to infinity, so as larger you have n, the smaller the band you will get $\endgroup$
    – rapaio
    Commented Jul 7, 2015 at 11:28
  • $\begingroup$ I am unsure as to what to apply the KS test to. I generate 1000 sets of simulated data and subsequently decimate these into a population average such that they can be overlaid with the experimental data (which is a single sample). I calculated d(0.05,n) using n=88, however in reality the population average is reflective of 1000 x 88 datapoints. How do I correctly go about this? $\endgroup$ Commented Jul 7, 2015 at 11:34

Your Answer

By clicking “Post Your Answer”, you agree to our terms of service and acknowledge you have read our privacy policy.

Not the answer you're looking for? Browse other questions tagged or ask your own question.