21
$\begingroup$

I am using the Mann-Kendall test to assess trends in a data time-series. I believe there is autocorrelation in my data and therefore need to use a block bootstrap to correct for it. I have plotted the autocorrelation to try to determine the block size to use in my block bootstrap. I have not found many resources on how to select this block? Comparing one example to my data I thought I should pick a length of $15$ as at lag $=15$ the points stay within the autocorrelation intervals (blue lines) but another source said $2-4$ is usually a sufficient block length and that a block length of $1/4$ of the sample size ($n$) can make the test insignificant. My data $n=64$ so $15$ is approaching $1/4$ of the sample size. How can I tell the best block size to pick from this plot (or another method?)
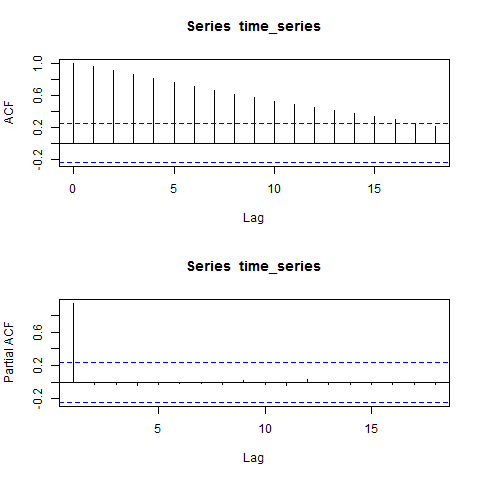
autocorrelation plot

$\endgroup$
3
  • $\begingroup$ This answer by @conjugateprior might be helpful. Two further sources are Bühlmann & Künsch (1999) and Politis & White (2004). Unfortunately I'm not knowledgeable enough about the subject to actually write an answer. $\endgroup$
    – Candamir
    Commented Nov 3, 2018 at 15:32
  • $\begingroup$ I have seen it written that an optimal block size is given by $O(n^{1/3})$ (stat.cmu.edu/~cshalizi/ADAfaEPoV/ADAfaEPoV.pdf) although no proof is provided. $n$ is the length of the data. Chapter 7 in 'Resampling methods for dependent data' discusses it at length but so far it is too theoretical for me! $\endgroup$
    – Aesir
    Commented Nov 30, 2018 at 11:07
  • $\begingroup$ forgot to leave page number above, page 587. $\endgroup$
    – Aesir
    Commented Nov 30, 2018 at 11:17

1 Answer 1

2
$\begingroup$

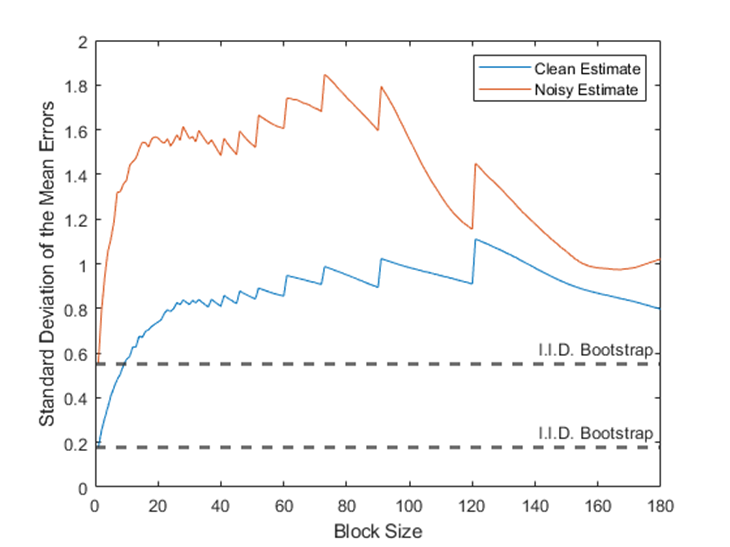
Old thread, worthy question. I've treated block length as a hyperparameter to tune, and plotted how it affected the parameter estimate. $n=1$ is a standard i.i.d. bootstrap, so it helped me visualize how the block bootstrap was affecting the results. Here's a figure to demonstrate, I ended up picking a block size around 20 for this data. Maybe not rigorous, but makes sense to my brain. a plot of the standard deviation of mean error versus block length, converging at a block length of 20

$\endgroup$

Your Answer

By clicking “Post Your Answer”, you agree to our terms of service and acknowledge you have read our privacy policy.

Not the answer you're looking for? Browse other questions tagged or ask your own question.