1
$\begingroup$

Situation: A website I work on has the following funnel: Home page (landing page) > pricing page > create account > convert (subscribe with credit card).

We ran a test on the pricing page. There were 4 variations + the original running at the same time. Each visitor who landed on the site was shown one of the 5 pricing pages.

In the past I have used a chi square test but in that situation there was just one test variant. Can I still use chi square somehow?

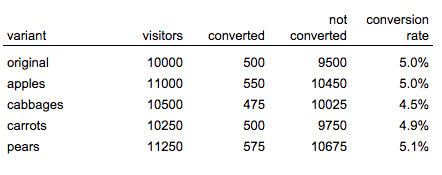
Here is how the data look:

Is pears really the best pricing page variant? Should we change our site to make pears the pricing page? Or is the difference likely down to chance and we would have seen these results if we just sent the different groups of visitors to the same page?

What method testing should I use?

Bonus points if you can provide the gist of how to do the test in R or Google Sheets. Perhaps there's a GSheets add on that you know of? Or a function? Or how do I do this in R?

I did do a fair bit of Google searching before posting but the internet is pretty crowded with testing methods making it tricky to find out which one I need in this exact scenario.

enter image description here

$\endgroup$

1 Answer 1

4
$\begingroup$

If this is really all of the data you have, then this is a simple logistic regression problem, and not multivariate at all. Your dependent (outcome) variable is the probability of a conversion, and the independent (manipulated) variable is the variant of the website used.

Multivariate problems are those in which you have more than one dependent variable, for instance conversion rate, and average amount of money spent.

Your predictor is categorical, so you're going to have to do two things. First, you test if there's any difference between the variants, in general (the main effect). Second, you compare each of the variants to every other one, to see if there's a significant difference between them.

This page looks like a decent introduction to this measure.

R code, where your data has a row for each visit to the site, and two columns, one specifying which variant that visitor saw, and one specifying if there was (value of 1) or wasn't (value of 0) a conversion:

m <- glm(conversion ~ variant, family=binomial, data=data)
summary(aov(m)) # Tests if there's a difference between the variants

library(lsmeans)
lsmeans(m, pairwise ~ variant) # Compares every variant to every other one

Alternatively, if your data has one row per variant, one column for the count of successful conversions (I'll call them successes, and one for the count of unsuccessful conversions (I'll call failures):

m <- glm(cbind(successes, failures) ~ variant, family=binomial, data=data)
anova(m, test='Chisq')

When comparing the variants with each other ("pairwise comparisons"), lsmeans by default compares everything to everything else, and adjusts the p value to account for these multiple comparisons. You may wish to only compare the original variant to everything else, as per your comment, which means that your p value won't be adjusted as heavily. This can still be done using lsmeans, but requires a little more work - you need to create contrast vectors specifying which conditions you want to compare. I've done this for your data below. To explain the first contrast, first.vs.second, c(1,-1,0,0,0) means "the difference between the first group (set to 1), and the second group (set to -1), with everything else set to 0, and so ignored.

m.comparisons = lsmeans(m, specs = pairwise ~ variant)
contrast(m.comparisons,
         list(
            first.vs.second = c(1,-1,0,0,0),
            first.vs.third = c(1,0,-1,0,0),
            first.vs.fourth = c(1,0,0,-1,0)),
            first.vs.fifth = c(1,0,0,0,-1)),
         adjust="tukey")

Finally, and this is very, very important: please don't just run the code I've provided, and consider your job complete. If you don't actually read up and understand some of how these analyses work, all of this information will be less than useless.

$\endgroup$
6
  • $\begingroup$ Thanks @Eoin for the answer. Two follow ups, if you will. You said "First, you test if there's any difference between the variants, in general (the main effect). Second, you compare each of the variants to every other one, to see if there's a significant difference between them". Surely I just want to compare each to the original (1st line item in screen)? Thanks for the intro to R script to get going with this, expect my data are aggregated and not line item by line item for each visitor. So all I have basically is the table int he screen shot. Can I still use lsmeans()? $\endgroup$
    – Doug Fir
    Commented Oct 7, 2015 at 12:53
  • $\begingroup$ I've edited my answer in response to your questions. $\endgroup$
    – Eoin
    Commented Oct 7, 2015 at 14:53
  • $\begingroup$ Oh, I've not really answered your first question. Usually, you don't run any pairwise comparisons unless you've already found a main effect. I think the main reason for this is that if you just compare everything to everything else all of the time, you're always going to find significant differences. This way, you only make the comparisons when you have evidence that there is something interesting happening. See stats.stackexchange.com/q/9751/42952 $\endgroup$
    – Eoin
    Commented Oct 7, 2015 at 15:00
  • 1
    $\begingroup$ Great answer @Eoin, but one comment. I think you should consider a bit more the "You may wish to only compare the original variant to everything else, as per your comment, which means that your p value won't be adjusted". If you have N groups (original + N-1) you won't perform all pairwise comparisons, but N-1 comparisons (original vs. rest N-1). When N gets larger the likelihood of finding a stat. sign. difference increases as well. $\endgroup$
    – AntoniosK
    Commented Oct 7, 2015 at 17:47
  • $\begingroup$ @AntoniosK, you're absolutely right. I meant to say "your p value won't be adjusted as heavily". Note that I explicitly specify Tukey adjustments in the call to the contrast function. I don't think this post is the place to spend a lot of time discussing multiple comparisons, mind you, there's plenty of excellent discussions of that topic on this site already. $\endgroup$
    – Eoin
    Commented Oct 7, 2015 at 18:04

Your Answer

By clicking “Post Your Answer”, you agree to our terms of service and acknowledge you have read our privacy policy.

Not the answer you're looking for? Browse other questions tagged or ask your own question.