If two variables have 0 correlation, why are they not necessarily independent? Are zero correlated variables independent under special circumstances ? If possible, I am looking for an intuitive explanation, not a highly technical one.
-
14$\begingroup$ Correlation is a measure of linear dependence (association). it is possible for two random variables to be uncorrelated but nonlinearly dependent. $\endgroup$– Mark L. StoneCommented Oct 31, 2015 at 2:37
-
1$\begingroup$ Intuitive explanation -> math.stackexchange.com/questions/444408/… $\endgroup$– SiddheshCommented Oct 31, 2015 at 3:20
-
6$\begingroup$ Zero correlation implies independence if the variables are multivariate normal. This is not the same as each variable being normal - see here for some scatterplots of zero-correlated but dependent normal variables (each variable is individually normal) $\endgroup$– Glen_bCommented Oct 31, 2015 at 8:55
-
1$\begingroup$ Correlation (unqualified) could include rank correlation, etc., for which monotonic dependence is the issue, and so forth. $\endgroup$– Nick CoxCommented Oct 31, 2015 at 11:12
-
1$\begingroup$ For outlook, I would recommend you to see Wikipedia "distance correlation" as a measure of independence. $\endgroup$– ttnphnsCommented Oct 31, 2015 at 13:44
7 Answers
Correlation measures linear association between two given variables and it has no obligation to detect any other form of association else.
So those two variables might be associated in several other non-linear ways and correlation could not distinguish from independent case.
As a very didactic, artificial and non realistic example, one can consider $X$ such that $P(X=x)=1/3$ for $x=-1, 0, 1$ and $Y=X^2$. Notice that they are not only associated, but one is a function of the other. Nonetheless, their correlation is 0, for their association is orthogonal to the association that correlation can detect.
-
1$\begingroup$ I was looking for evidence of random variances being uncorrelated yet dependent however none of the direct answers to my question revealed intuitive facts. your answer, on the other hand, gives me a very good angle to think about it, thanks a lot! $\endgroup$– stucashCommented Apr 19, 2019 at 17:19
-
1$\begingroup$ @stucash my pleasure! It was an old counter example I learnt $\endgroup$ Commented Jun 6, 2019 at 1:04
There is a generalized lack of rigor in the use of the word "correlation" for the simple reason that it can have widely differing assumptions and meanings. The simplest, loosest and most common usage is that there is some vague association, relationship or lack of independence between a static pair of random variables.
Here, the default metric referred to is usually the Pearson correlation, which is a standardized measure of pairwise, linear association between two continuously distributed variables. One of the Pearson's commonest misuses is to report it as a percentage. It is definitely not a percentage. The Pearson correlation, r, ranges between -1.0 and +1.0 where 0 means no linear association. Other not so widely recognized issues with using the Pearson correlation as the default is that it is actually quite a stringent, non-robust measure of linearity requiring interval-scaled variates as input (see Paul Embrechts' excellent paper on Correlation and Dependency in Risk Management: Properties and Pitfalls here: https://people.math.ethz.ch/~embrecht/ftp/pitfalls.pdf).
Embrechts notes that there are many fallacious assumptions about dependence that begin with assumptions of the underlying structure and geometric shape of these relationships:
These fallacies arise from a naive assumption that dependence properties of the elliptical world also hold in the non-elliptical world
Embrechts points to copulas as a much wider class of dependence metrics used in finance and risk management, of which the Pearson correlation is just one type.
Columbia's Statistics department spent the academic year 2013-2014 focused on developing deeper understandings of dependence structures: e.g., linear, nonlinear, monotonic, rank, parametric, nonparametric, potentially highly complex and possessing wide differences in scaling. The year ended with a 3 day workshop and conference that brought together most of the top contributors in this field (http://datascience.columbia.edu/workshop-and-conference-nonparametric-measures-dependence-apr-28-may-2).
These contributors included the Reshef Brothers, now famous for a 2011 Science paper Detecting Novel Associations in Large Data Sets http://www.uvm.edu/~cdanfort/csc-reading-group/reshef-correlation-science-2011.pdf that has been widely criticized (see AndrewGelman.com for a good overview, published simultaneously with the Columbia event: http://andrewgelman.com/2014/03/14/maximal-information-coefficient). The Reshefs addressed all of these criticisms in their presentation (available on the Columbia conference website), as well as a vastly more efficient MIC algorithm.
Many other leading statisticians presented at this event including Gabor Szekely, now at the NSF in DC. Szekely developed his distance and partial distance correlations. Deep Mukhopadhay, Temple U, presenting his Unified Statistical Algorithm -- a framework for unified algorithms of data science -- based on work done with Eugene Franzen http://www.fox.temple.edu/mcm_people/subhadeep-mukhopadhyay/. And many others. For me, one of the more interesting themes was wide leverage and use of Reproducing Kernel Hilbert Space (RKHS) and the chi-square. If there was a modal approach to dependence structures at this conference, it was the RKHS.
The typical intro statistics textbooks is perfunctory in its treatment of dependence, usually relying on presentations of the same set of visualizations of circular or parabolic relationships. More sophisticated texts will delve into Anscombe's Quartet, a visualization of four different datasets possessing similar, simple statistical properties but hugely differing relationships: https://en.wikipedia.org/wiki/Anscombe%27s_quartet
One of the great things about this workshop was the multitude of dependence structures and relationships visualized and presented, going far beyond the standard, perfunctory treatment. For instance, the Reshefs had dozens of thumbnail graphics that represented just a sampling of possible nonlinearities. Deep Mukhopadhay had stunning visuals of highly complex relationships that looked more like a satellite view of the Himalayas. Stats and data science textbook authors need to take note.
Coming out of the Columbia conference with the development and visualization of these highly complex, pairwise dependence structures, I was left questioning the ability of multivariate statistical models to capture these nonlinearities and complexities.
-
3$\begingroup$ I just came across this excellent and exhaustive discussion of measures of association on Quora: quora.com/… $\endgroup$ Commented Oct 31, 2015 at 15:53
-
$\begingroup$ From an etymological point of view, co-relation is the relationship between two variables. Independence between two variables is a relationship bt two variables. Then they are synonyms. If you could calculate any possible correlation, then it could be understood as an independence test. $\endgroup$ Commented Jun 21, 2023 at 20:39
-
1$\begingroup$ This is a great paper that talks about independence test using a binary classifier arxiv.org/abs/1610.06545 $\endgroup$ Commented Jun 21, 2023 at 20:40
It depends on your exact definition of "correlation", but it isn't too hard to construct degenerate cases. "Independent" could mean something like "no predictive power, at all, ever" just as much as "linear correlation".
Linear correlation, for example, would not indicate dependence on $y= \sin(2000x)$ if the domain of $x$ was $[0,1)$.
An intuitive example would be a circle. I have two variables $X$ and $Y$. And they are satisfy the equation
$$X^2+Y^2=1$$
Now, $X$ and $Y$ are definitely not independent to each other, because given $X$ we can calculate $Y$ and vice versa. But their person correlation coefficient is $0$. This is because it only captures the linear relationship between two variables.
Basically, dependence of Y on X means the distribution of values of Y depends on some way of the value of X. That dependence can be on the mean value of Y (the usual case presented in most of the answers) or whatever other characteristic of Y.
For example, let X be 0 or 1. If X = 0 then let Y be 0, if X= 1 let Y be -1, 0 or 1 (same probability). X and Y are uncorrelated. On mean, Y doesn't depend on X because whatever value is X, the mean of Y is 0. But clearly the distribution of values of Y depends on X value. In this case, for example, the variance of Y is 0 when X=0 and > 0 when X=1, thus there is, at least, a dependence on variance, i.e. there is a dependence.
So, linear correlation only show a type of dependence on mean (linear dependence), that in turn is only a special case of dependence.
Adding to @Marcelo Ventura and @Mike Hunter great answers, and the reference to a great discussion around this on Quora.
An important point (implicit) is made in here and in the quora thread. Although correlation is a linear measure, it does not exclusively mean it can only quantify the relationship between linearly dependent variables.
Arguably an equally important factor is whether there is a monotone relationship between variables. As stated on minitab
In a monotonic relationship, the variables tend to move in the same relative direction, but not necessarily at a constant rate. In a linear relationship, the variables move in the same direction at a constant rate.
This means if we have non-monotone related variables we can observe a zero correlation even though they are not independent
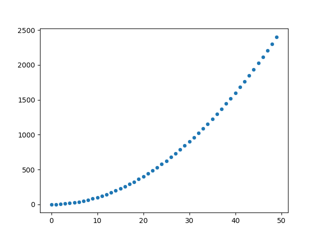
To illustrate this say for example we have a $f(x) = x^2$, using python to evaluate the function
If we look at $x$ in $[0, 50)$, we find that $f(x)$ has a monotone relationship with $x$, as a result we observe the correlations to be close to 1:
import numpy as np
import seaborn as sns

x = np.arange(0, 50, 1)
f = lambda x: x ** 2
y = f(x)
sns.scatterplot(x, y)
# Get correlations using scipy
from scipy.stats import pearsonr, spearmanr
pearsonr(x, y)[0]
spearmanr(x, y)[0]
- Pearson Correlation:
0.967 - Spearman Correlation:
0.999...
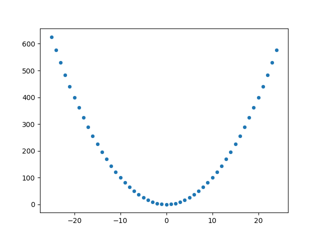
Now if we look at $x$ in $[-25, 25)$, we find $f(x)$ no longer has a monotone relationship with $x$, the correlations are thus close to zero as expected:
x = np.arange(-25, 25, 1)
y = f(x)
sns.scatterplot(x, y)
pearsonr(x, y)[0]
spearmanr(x, y)[0]
- Pearson Correlation:
-0.077 - Spearman Correlation:
-0.059
Zero correlation does not imply independence for multiple reasons. One of these is possible is that two variables could be dependent on a third causing correlation.
-
1$\begingroup$ Welcome to Cross Validated! If that third variable causes there to be correlation between the first two, then aren’t the first two variables correlated? $\endgroup$– DaveCommented Feb 21, 2023 at 3:37


