16
$\begingroup$

For homework, I was given data to create/train a predictor that uses lasso regression. I create the predictor and train it using the lasso python library from scikit learn.

So now I have this predictor that when given input can predict the output.

The second questions was to "Extend your predictor to report the confidence interval of the prediction by using the bootstrapping method."

I've looked around and found examples of people doing this for the mean and other things.

But I am completely lost on how I'm suppose to do it for a prediction. I am trying to use the scikit-bootstrap library.

The course staff is being extremely unresponsive, so any help is appreciated. Thank you.

$\endgroup$
3
  • $\begingroup$ I do not know how to use Scikit but if it is only Scikit you are interested in then you should move this question to StackOverflow. That being said, you have to remember that your predictions are a mean-response in themselves. What you will get through the bootstrapping procedure is a way to estimate the distribution of that mean response. $\endgroup$
    – usεr11852
    Commented Nov 23, 2015 at 22:34
  • $\begingroup$ @usεr11852 I'm limited to just using scikit at the moment. But If I can understand the theory behind bootstrapping confidence interval of predictions I may not need any python help. For instance, I'm not sure what I will be sampling from, the data in which I use to train the predictor or the predictions? I'm really confused on how to sample because one prediction is related to only one sample i.e. a specific set of features. $\endgroup$
    – itsSLO
    Commented Nov 23, 2015 at 22:41
  • 1
    $\begingroup$ Note that it is wrong to speak of a "confidence interval of the prediction" because a prediction is not a parameter. $\endgroup$
    – Michael M
    Commented Aug 17, 2016 at 7:46

2 Answers 2

15
$\begingroup$

Bootstrapping refers to resample your data with replacement. That is, instead of fitting your model to the original X and y, you fit your model to resampled versions of X and y for multiple times.

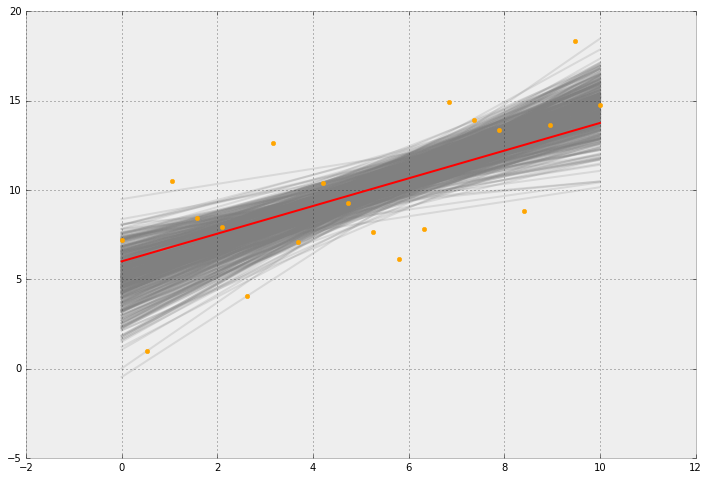
Thus, you get n slightly different models which you can use to create a confidence interval. Here is a visual example of such an interval.

import numpy as np
import matplotlib.pyplot as plt
from sklearn.linear_model import LinearRegression

# Create toy data 
x = np.linspace(0, 10, 20)
y = x + (np.random.rand(len(x)) * 10)

# Extend x data to contain another row vector of 1s
X = np.vstack([x, np.ones(len(x))]).T

plt.figure(figsize=(12,8))
for i in range(0, 500):
    sample_index = np.random.choice(range(0, len(y)), len(y))

    X_samples = X[sample_index]
    y_samples = y[sample_index]    

    lr = LinearRegression()
    lr.fit(X_samples, y_samples)
    plt.plot(x, lr.predict(X), color='grey', alpha=0.2, zorder=1)

plt.scatter(x,y, marker='o', color='orange', zorder=4)

lr = LinearRegression()
lr.fit(X, y)
plt.plot(x, lr.predict(X), color='red', zorder=5)

enter image description here

$\endgroup$
9
$\begingroup$

If you want to use scikit's API for the bootstrap part of the code:

import numpy as np
import matplotlib.pyplot as plt
from sklearn.linear_model import LinearRegression
from sklearn.ensemble import BaggingRegressor

# Create toy data 
x = np.linspace(0, 10, 20)
y = x + (np.random.rand(len(x)) * 10)

# Extend x data to contain another row vector of 1s
X = np.vstack([x, np.ones(len(x))]).T

n_estimators = 50
model = BaggingRegressor(LinearRegression(), 
                         n_estimators=n_estimators,
                         bootstrap=True)

model.fit(X, y)

plt.figure(figsize=(12,8))

# Accessing each base_estimator (already fitted)
for m in model.estimators_:
    plt.plot(x, m.predict(X), color='grey', alpha=0.2, zorder=1)

plt.scatter(x,y, marker='o', color='orange', zorder=4)

# "Bagging model" prediction
plt.plot(x, model.predict(X), color='red', zorder=5)
$\endgroup$
1
  • 6
    $\begingroup$ Although implementation is often mixed with substantive content in questions, we are supposed to be a site for providing information about statistics, machine learning, etc., not code. It can be good to provide code as well, but please elaborate your substantive answer in text for people who don't read this language well enough to recognize & extract the answer from the code. $\endgroup$ Commented Sep 26, 2018 at 1:18

Your Answer

By clicking “Post Your Answer”, you agree to our terms of service and acknowledge you have read our privacy policy.

Not the answer you're looking for? Browse other questions tagged or ask your own question.