4
$\begingroup$

I'm working with categorical data and want to run a chi squared test. I want to test the frequencies:

A = list(12455, 11554, 11908, 13416, 12647, 7828, 10172) 

against the distribution of frequencies in a larger set:

B = list(181395, 165347, 175331, 193760, 190370, 124226, 157822)

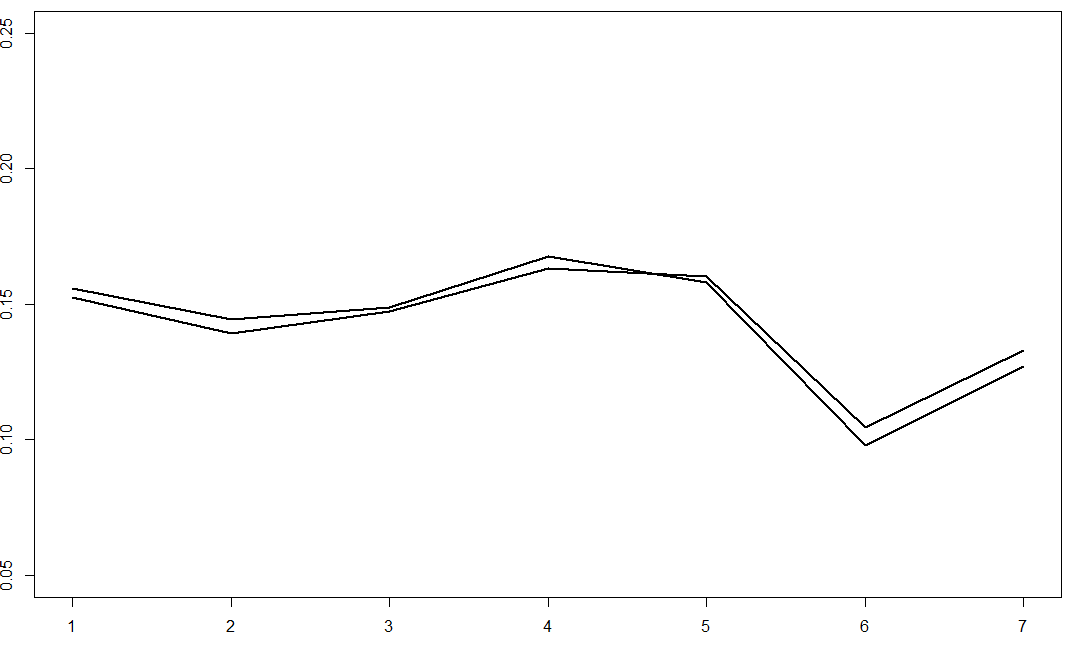
A is a is sub category of the entire population B and I want to see if A differs from B. Plotting the percentages and looking at the graph I thought that A would not differ from B. (A starts on top)

A is the line that starts above

Calculating the expected frequencies I get

expected = list(12209.518, 11129.343, 11801.356, 13041.794, 12813.616,  
                8361.529, 10622.843)
observed = list(12455, 11554, 11908, 13416, 12647, 7828, 10172)

Now if I run a chi squared test I will have 6 degrees of freedom because I have 7 categories. This means that if my test statistic is larger than 12.59 then I would have reject the null hypothesis that A follows the same distribution to B.

Since my frequencies are large my test statistic becomes very large. However if I had the same distribution of B but the frequencies in A were an order (or 2) of magnitude smaller each difference would not add as much to the test statistic and I would get a different answer. For example using the above observed and expected values the individual terms of the test statistic are

\begin{align} \frac{({\rm obs}-{\rm exp})^2}{{\rm exp}} &= 4.9356051 + 16.2034261 + 0.9636932 + 10.7370279 + \\ &\quad\; 2.1665275 + 34.0432283 + 19.1341639 \\[10pt] &= 88.18367 \end{align}

If A would have frequencies in the 1000's instead of 10 000's. we would get

obs' = list(1246, 1155, 1191, 1342, 1265,  783, 1017)
exp' = list(1221.1045, 1113.0735, 1180.2832, 1304.3425, 1281.5219, 
            836.2575, 1062.4171)

And a resulting test statistic of 8.817601, which would mean I do not reject the null since 8.817601 < 12.59.

With all that said it seems that if you have large frequencies the slightest of change in percentages will will cause the chi squared test to reject the null even though the two distributions look very similar.

Is chi squared test applicable when frequencies are very large? is my understanding of comparing A and B using chi squared correct? Is A actually significantly different from B?

$\endgroup$
0

2 Answers 2

2
$\begingroup$

This isn't particular to the chi-squared test; it is a design feature (not a bug) of hypothesis testing generally. A test of a null hypothesis gives you, in a colloquial sense, a measure of the confidence you can have that the null hypothesis is false. To do so, it conflates two different things: the magnitude of the difference between your data and the null (i.e., the effect size), and the amount of information you have about the estimated value[s] in your dataset (i.e., $N$).

On the other hand, note that you are mistaken that very large frequencies (but a constant fraction of the population frequencies) will necessarily yield a significant result. In fact, the opposite is true: if the frequencies are a constant fraction, the result will be non-significant no matter how large the frequencies are. Consider the following simple example, coded in R. I have created very large observed frequencies exactly half the population frequencies by multiplying B by $50$, while making the population B times $100$. The resulting $p$-value is $1.0$:

A = c(12455, 11554, 11908, 13416, 12647, 7828, 10172)
B = c(181395, 165347, 175331, 193760, 190370, 124226, 157822)
chisq.test(x=B*50, p=B*100/sum(B*100))
#  Chi-squared test for given probabilities
# 
# data:  B * 50
# X-squared = 2.1483e-25, df = 6, p-value = 1

It is completely possible to be very sure that your data differ from the null and to be sure that difference is trivial (cf., the end of my answer here: Why do statisticians say a non-significant result means “you can't reject the null” as opposed to accepting the null hypothesis?). In essence, that is the situation you are describing in your example with large frequencies. Likewise, there are three other possible combinations that can occur: small differences that you aren't confident aren't caused by chance alone, large differences that you aren't confident aren't caused by chance alone, and large differences that you are confident aren't caused by chance alone.

$\endgroup$
5
  • 2
    $\begingroup$ Put it this way: Do you feel the same about 7 heads out of 10, 70/100, 700/1000, 7000/10000, etc.? $\endgroup$
    – Nick Cox
    Commented Dec 10, 2015 at 17:25
  • $\begingroup$ I probably should have worded my concern about large frequencies better. I understand that if you have a distribution X and a second distribution Y = aX you will get a p-value of 1. however that doesn't happen with real data. My concern is more centered around performing a chi squared test with high frequency when you can almost guarentee that Y != aX for all a. $\endgroup$
    – Marsenau
    Commented Dec 10, 2015 at 18:35
  • 2
    $\begingroup$ @user2864849, then you can "almost guarantee" a significant result, as you have large N & can almost guarantee that the null is false. Again, it is totally possible to be very sure the profile of your data differs from the population profile, & be very sure the difference is trivial, at the same time. $\endgroup$ Commented Dec 10, 2015 at 18:42
  • $\begingroup$ @gung Then for large frequencies is there a better test that I'm drawing a blank on that can give me the same insight as chi squared would with less data? $\endgroup$
    – Marsenau
    Commented Dec 10, 2015 at 18:48
  • $\begingroup$ @user2864849, the chi-squared test is working as it is supposed to. This is 'feature by design' for all hypothesis testing. It may help you to read the other answer I linked to. Re your specific situation, you could look at effect sizes, or manually check to see if the proportions in the cells differ by less than you would care about. $\endgroup$ Commented Dec 10, 2015 at 18:53
0
$\begingroup$

A significant difference in distribution doesn't mean they are practically different.

Graphing the difference as you've done is often a good way to determine if the difference in distributions is practically significant or not. In fact, many diagnostic tests for distribution assumptions rely on graphs rather than tests of significance for this reason.

Given a large enough sample size you will always reject the null hypothesis unless it is exactly true. See related question for more detail.

$\endgroup$

Your Answer

By clicking “Post Your Answer”, you agree to our terms of service and acknowledge you have read our privacy policy.

Not the answer you're looking for? Browse other questions tagged or ask your own question.