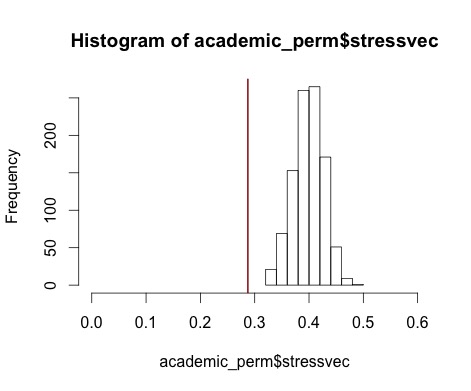
I have a dissimilarity data matrix with 7 rows and 7 columns (two ways). Having done unfolding on it, I wanted to evaluate the observed stress value. Using permutation test with 1000 replication, the p-value of the observed stress became 0.[the histogram is provided below] Now, What is the interpretation of the p.value in this context? The observed stress is extremely rare, and consequently significant but what does it mean in the unfolding context? What should I do in such cases?
1 Answer
I found the answer in Patrick Mair presentation under the title of "Permutation test in MDS". The permtest() function in the package, permutes the dissimilarity values of the delta matrix(dissimilarity matrix) and the null hypothesis is "there is no structure behind the dissimilarity matrix, dissimilarities are random". Therefore, in my case, we reached to a conclusion that the dissimilarities are not spread randomly in the matrix. I wonder how it can help to evaluate the stress-value of the original dissimilarity matrix. I knew that my data is structured, this test doesn't help me to evaluate and improve the stress.

