2
$\begingroup$

During stats courses on Uni I learnt (if I remember correctly and hopefully don't put my teachers to shame) that if you want to compare multiple groups with each other you look at the residuals of an ANOVA test. If the residuals are normally distributed, it is the right test to use and you can do a post-hoc on it (Tukey for instance). If not, you go to Kruskal-Wallis and can do a Scheffe post hoc.

I am doing data analysis in R and find much more complicated answers to this problem when googling, among which is https://www.researchgate.net/post/Which_post_hoc_test_is_best_to_use_after_Kruskal_Wallis_test

I have count data on species on 9 different sites (6 samples per site). Most species only occur there very rarely and in very low numbers. So the frequency of count 0 is very high. In R I can run an anova, both assuming a Gaussian distribution, but also assuming Poisson, quasi-Poisson and negative binomial distributions. I managed to make a plot with the observed frequencies of my counts and the expected frequencies based on these distributions, and none of the distributions seem to match nicely. This is a graph for one of those species:plot with the observed frequencies of my counts and the expected frequencies based on different distributions
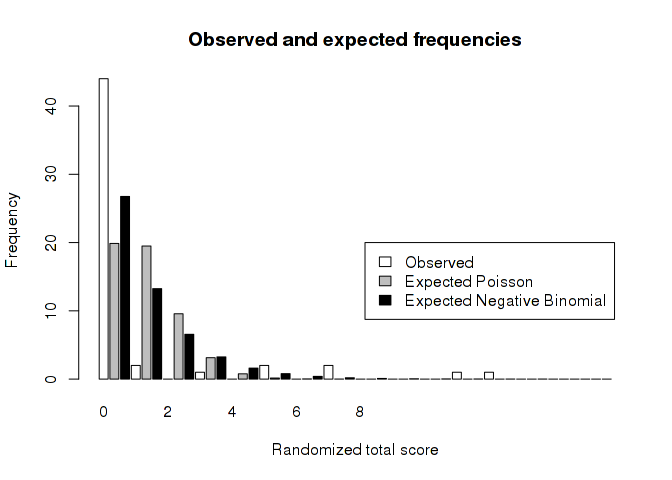
So if I am correct, the only thing that is left to me is using a non-parametric test like Kruskal-Wallis to compare the mean counts between the 9 different sites. Is this correct? And if so, what post hoc test could I use to test the pairwise between-site differences?

$\endgroup$
2
  • 1
    $\begingroup$ The one option you didn't list is a zero-inflated negative binomial model. Based both on your description and the frequency distribution, this would seem to be a sensible choice. $\endgroup$
    – dbwilson
    Commented Dec 12, 2020 at 14:41
  • 3
    $\begingroup$ The Kruskal-Wallis test only provides omnibus evidence against equality of means if (a) all groups share the same distribution shape, and (b) all groups share the same variance. The K-W hypothesis generalizes from the rank sum null thus: $\text{H}_{0}\text{: }P(X_i > X_j) = 0.5$ for all $i\ne j$, and where $i$ and $j$ index group. In words the null is the probability that a randomly selected value from group $i$ is greater than a randomly selected value from group $j$ is one half, for all pairs of different groups. $\endgroup$
    – Alexis
    Commented Apr 11, 2021 at 22:10

2 Answers 2

1
$\begingroup$

Since too much subjectivity is involved in checking normality of residuals, and since a large sample size may be required to reliably select a distribution, it's best just to plan on using the generalization of the Kruskal-Wallis test: the proportional odds ordinal logistic model. See Chapter 7 of BBR. Semiparametric regression models such as the proportional odds model allow the distribution at a given covariate setting to be anything, including allowance for extreme clumping at zero --- beyond what a zero inflated Poisson or negative binomial can accomplish. This flexibility comes from having $k-1$ intercepts in the model for $k$ distinct values of $Y$.

Within this framework you can form contrasts easily, and even get simultaneous confidence intervals. Effects are stated in terms of odds ratios. The overall likelihood ratio $\chi^2$ test from the model is the most accurate test for comparing all the groups with each other.

$\endgroup$
-1
$\begingroup$

I am still figuring this out, and please correct me if I'm wrong but I have found out quite a bit more in the last few days.

Yes, if you can't do an ANOVA, the non-parametric Kruskal-Wallis is the only option left if you want to strictly want to analyse the means of multiple groups. Especially the different distributions that I mentioned were a dead end as far as an anova goes. The anova methods of R don't allow for specifying a different expected distrubtions. Yes you can do aov(glm(, family="poisson")) but that only does an anova for the formula specified in the glm. It ignores the family part of it. You can also use anova(model1,model2) to test two different models and see if they significantly differ in the fit of each of them, but that is something different.

There is another option though. You can actually use glm to fit a model to your data, and test which model fits best. The pdf "Regression Models for Count Data in R" by Zeileis, Kleiber and Jackman is a pretty helpful pdf on this. What you can do is fit different models, find the model which explains the data best (with the lowest AIC for instance) and test if that significantly better predicts your data than formula y~1. You can use the Wald test or Likelihood Ratio test for that.

Secondly the model's coefficients are tested using partial wald tests in the glm itself and significance of each coefficient is printed in the summary already. So that gives an indication of which coefficients (factor levels) actually have a significant influence on the mean of the complete data. So this can be used instead of pairwise tests like often done after an anova/aov. There is a difference in interpretation though if I'm correct. The glm tests the influence of each coefficient on the response variable for all data together, while pairwise tests test the mean of one group vs the mean of another group. So they test for each combination of groups if one group is significantly different from another, while the partial wald tests of the coefficients of a glm compare the coefficient to the whole population.

$\endgroup$
2
  • $\begingroup$ –1 "Yes, if you can't do an ANOVA, the non-parametric Kruskal-Wallis is the only option left if you want to strictly want to analyze the means of multiple groups." This is not true. For example, the $\chi^2$ contingency table test (or the $G$ contingency table test) can be used to test either unblocked proportions across multiple groups, or unblocked categorical outcomes (>2 categories) across multiple groups. Likewise, Cochran's $Q$ test can be used to test binary outcomes/proportions in blocked designs or repeated measures for multiple groups. $\endgroup$
    – Alexis
    Commented Jul 1, 2022 at 18:04
  • 1
    $\begingroup$ Also, K-S does not, properly speaking, "analyze means". Could also have mentioned permutation tests in my first comment. $\endgroup$
    – Alexis
    Commented Jul 1, 2022 at 19:14

Your Answer

By clicking “Post Your Answer”, you agree to our terms of service and acknowledge you have read our privacy policy.

Not the answer you're looking for? Browse other questions tagged or ask your own question.