2
$\begingroup$

I currently have a log-log model. Its scatter plot looks like this: enter image description here
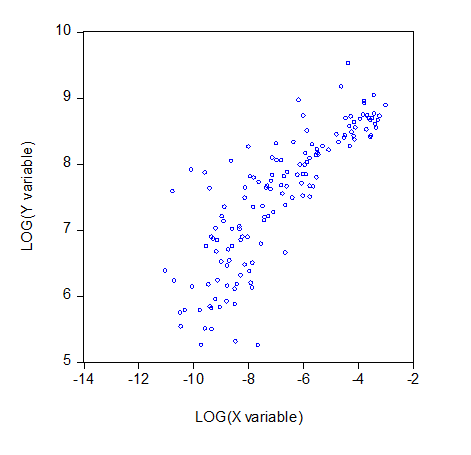
I am currently stuck after this. I need to find a non-linear relationship to predict how log (X Variable) will affect log (Y Variable). Would simply using this log-log model be enough to predict? Or would I need to manipulate the model further by adding another term such as a squared log(x variable) term, much like in a quadratic model?

$\endgroup$
3
  • $\begingroup$ Welcome to the site. Can you clarify why you would "need to find a non-linear relationship to predict how log (X Variable) will affect log (Y Variable)?" Is this part of a class assignment that specifically asked for it? $\endgroup$ Commented Apr 16, 2016 at 4:41
  • $\begingroup$ Yes, the class assignment specifically asked for it. $\endgroup$ Commented Apr 16, 2016 at 4:42
  • $\begingroup$ Since this is a class assignment, please add the self-study tag $\endgroup$ Commented Apr 16, 2016 at 13:53

1 Answer 1

1
$\begingroup$

I think you should try to fit a polynomial regression because your data looks like a shaped distribution. Once you fit polynomial, you may want to compare it with the linear regression by likelihood-ratio test to convince yourself that your polynomial fitting is worth the loss of one or more degrees of freedom. Your polynomial model will always fit no worse than a simple linear model, the likelihood-ratio test will tell you whether it'd be a good idea to do so.

From the plot, it looks like a second-order polynomial should be sufficient.

$\endgroup$

Your Answer

By clicking “Post Your Answer”, you agree to our terms of service and acknowledge you have read our privacy policy.

Not the answer you're looking for? Browse other questions tagged or ask your own question.