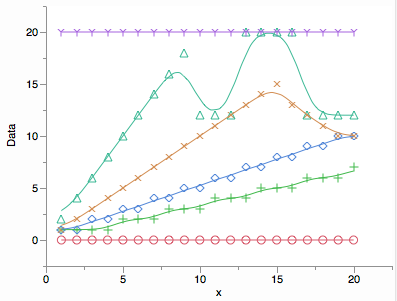
I'm displaying time-series data as a "stacked line" or "stacked area" chart. (E.g. with percentage data, data points at 10%, 20% and 30% are displayed at 10%, 30% and 60% on the chart.) Unsmoothed lines through the data points obviously never cross (and never go below the minimum data value or above the maximum total; think 0% and 100% again for instance). I'm looking for a smoothing function that will preserve these properties; that is, the smoothed lines should never cross (including between data points), should never exceed the maximum/minimum values given by the data points, and (ideally) should only touch at data points. Does such a beast exist?
As is probably apparent, I'm not a statistician. The smoothing here is only for visual appeal, so solutions that are theoretically less than ideal are still definitely on the cards.

