9
$\begingroup$

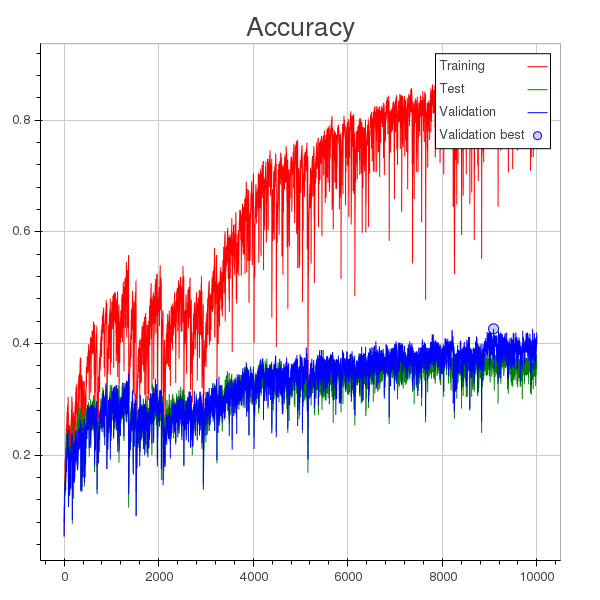
I'm training a classification model, and these are the plots for accuracy and loss history.

Accuracy plot Loss plot

Besides the fact that the learning rate is too large, what I understand is that the model start overfitting at around epoch 1000 (you can see a round dot in the loss plot which indicates the minimum loss computed for validation throughout all training), however validation accuracy keeps increasing, though slowly.

At first I thought that when reshuffling each split's samples I was mistakenly mixing training and validation samples, but that does not seem the case.

Is something wrong going on here? Or does reducing training error somehow reflects on validation accuracy, even when overfitting?

UPDATE: Apparently, a few samples in the validation set are quite similar to samples in the train set. What I've found is that as training goes on, the model learns to recognize those samples, while the loss it incurs into when it makes mistakes becomes very large, thus causing the average loss to keep increasing.

$\endgroup$
4
  • 1
    $\begingroup$ Though not the dominant effect here, your use of an improper accuracy scoring rule will have a negative impact on what you are trying to do. For example, you can increase proportion "classified" "correctly" by dropping very important features. $\endgroup$ Commented Apr 28, 2016 at 11:40
  • $\begingroup$ Did you debug this out? I'm getting a similar loss curve as well. $\endgroup$ Commented Aug 29, 2017 at 20:40
  • $\begingroup$ Check my update. Basically, what happens is that accuracy increases because the model is able to classify correctly more samples, although the margin from the other class is relatively small. However, when the model makes mistakes, for some reason the loss for those mistakes is very high, so all in all the total loss increases. $\endgroup$
    – rand
    Commented Sep 7, 2017 at 8:01

2 Answers 2

7
$\begingroup$

I think this reflects the nature of your data whereby you can get increasing accuracy at the expense of the more useful measure of loss.

By way of explanation imagine that your data is the stock market and you want to classify up or down days for the purpose of investing. In this scenario not all days are of equal value - a relatively few days will make or break your investing career - and increasing the classification accuracy of the days that have have little or no movement is irrelevant to your desired outcome of making a profit. It would be much better to have pretty poor accuracy in aggregate but actually be highly accurate in predicting the few days when the market makes monster moves.

$\endgroup$
7
$\begingroup$

I think it can be that even though the "spread" between classification and validation accuracy starts increasing, all of them keep increasing for many epochs.

You can be sure of being in overfitting regime only when generalization performance really starts to decrease, so that the validation error curve becomes a U plot. So I wouldn't necessarily infer an overfitting problem from the graph above.

What is strange is the corresponding loss graph below. There I would see a very clear overfitting starting around epoch 3000, but it seems that increase in validation loss doesn't reflect in decrease in validation classification. That is a bit strange.

What loss function are you using?

It could be that the class clusters are very compact in your case so there is not really much difference between training and test samples, so overfitting doesn't show easily. But that loss graph is suspicious..

$\endgroup$
1
  • $\begingroup$ I'm seeing an identical case using CTC loss. Validation loss increases, the model doesn't seem to diverge (yet) as the accuracy also increases (on validation). How can we explain this suspicious loss behaviour ? $\endgroup$ Commented Jun 5, 2018 at 10:17

Your Answer

By clicking “Post Your Answer”, you agree to our terms of service and acknowledge you have read our privacy policy.

Not the answer you're looking for? Browse other questions tagged or ask your own question.