2
$\begingroup$

I'm working on dataset which isn't normally distributed. It contains three dimensions: cost, discount and profit.

I'm trying to find outliers in all these dimensions. I used $\text{z-score}$ to find outliers in single dimension to find high cost causing outliers.

As a next step I tried to find outliers with high cost and high profit and low discount.

I came up with a formula of

$$ \text{z-score}(cost)+\text{z-score}(profit)-\text{z-score}(discount) $$

(negative sign because I want to find outliers with low discount).

Is this approach meaningful? Or is there any further proven way to achieve this?

$\endgroup$
4

2 Answers 2

1
$\begingroup$

The problem of using only z-score to determine outliers is that if works pretty okay if your variables are independent but they show bad results when they have high correlation between each other.

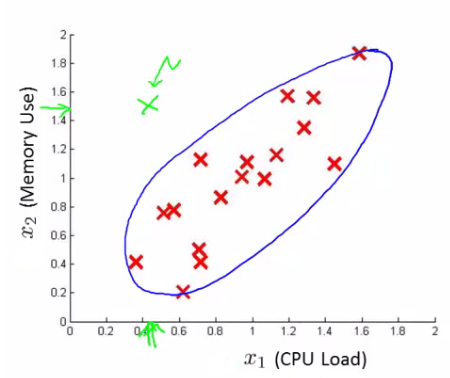
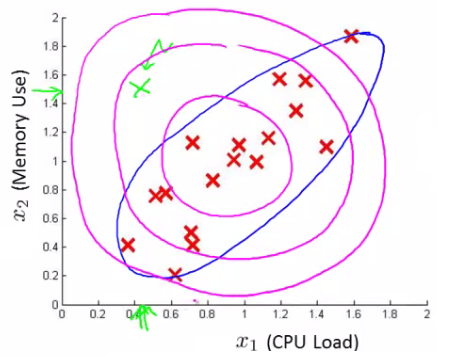
For example, in the plot below the blue circle is what you expect your normal data to be in.

Blue line is your classification of normal data

You have a new data plotted in green which you expect to be classified as an $outlier$. But according to a z-score analysis (plotted in pink) your new data is classified as $normal$.

enter image description here

To avoid this problem of interpretation you can use Anomaly Detection Systems for giving better predictions or - if you have a lot of data on your outliers - you can use Logistic Regression so it can adapt to what you are looking for.

$\endgroup$
3
  • $\begingroup$ I've tried out anomaly detection as well , but the problem is how to model the features like high profit, low cost .. I've tried to overcome it using zscore using negative sign for low cost any input for the same in anomaly detection? $\endgroup$
    – tourist
    Commented May 2, 2016 at 5:34
  • $\begingroup$ If I am understainding your problem right, you don't need to model your features. Let your anomaly detection system identify all your outliers and if you wish to select only those datas with high profit and low cost you can filter them using (Xprofit > MUprofit)*(Xcost < MUprofit), where X is your data and MU is the mean. You will end up with a vector with 0s and 1s, where the ones are the outliers that satisfies all your conditions. $\endgroup$ Commented May 3, 2016 at 20:40
  • $\begingroup$ For your example here mahalanobis distance would work $\endgroup$ Commented Apr 25, 2018 at 0:42
0
$\begingroup$

If these three variables were independent then you wouldn't be asking this question, and simply used the z-score. So, I assume that there's significant correlation between the variables which is a cause of concern for you. You want a measure of outlierness that accounts for common movements of variables.

I suggest PCA. Run a PCA analysis, and analyze z-scores of principal components. They are independent by construction, so you can analyze their z-scores. The point is that you can apply a univariate outlier detection now.

Implementation details

The PC scores don't have to be normal, of course, so you may need to fit other than normal distribution to get p-values, which is a technicality.

You may need to first transform the variables into stationary series. For instance, often cost variable in long series is not stationary due to inflation. In this case a common approach is to either look at the difference or log difference of cost. Once you dealt with non-stationarity, apply PCA and get the series of three scores.

$\endgroup$

Your Answer

By clicking “Post Your Answer”, you agree to our terms of service and acknowledge you have read our privacy policy.

Not the answer you're looking for? Browse other questions tagged or ask your own question.