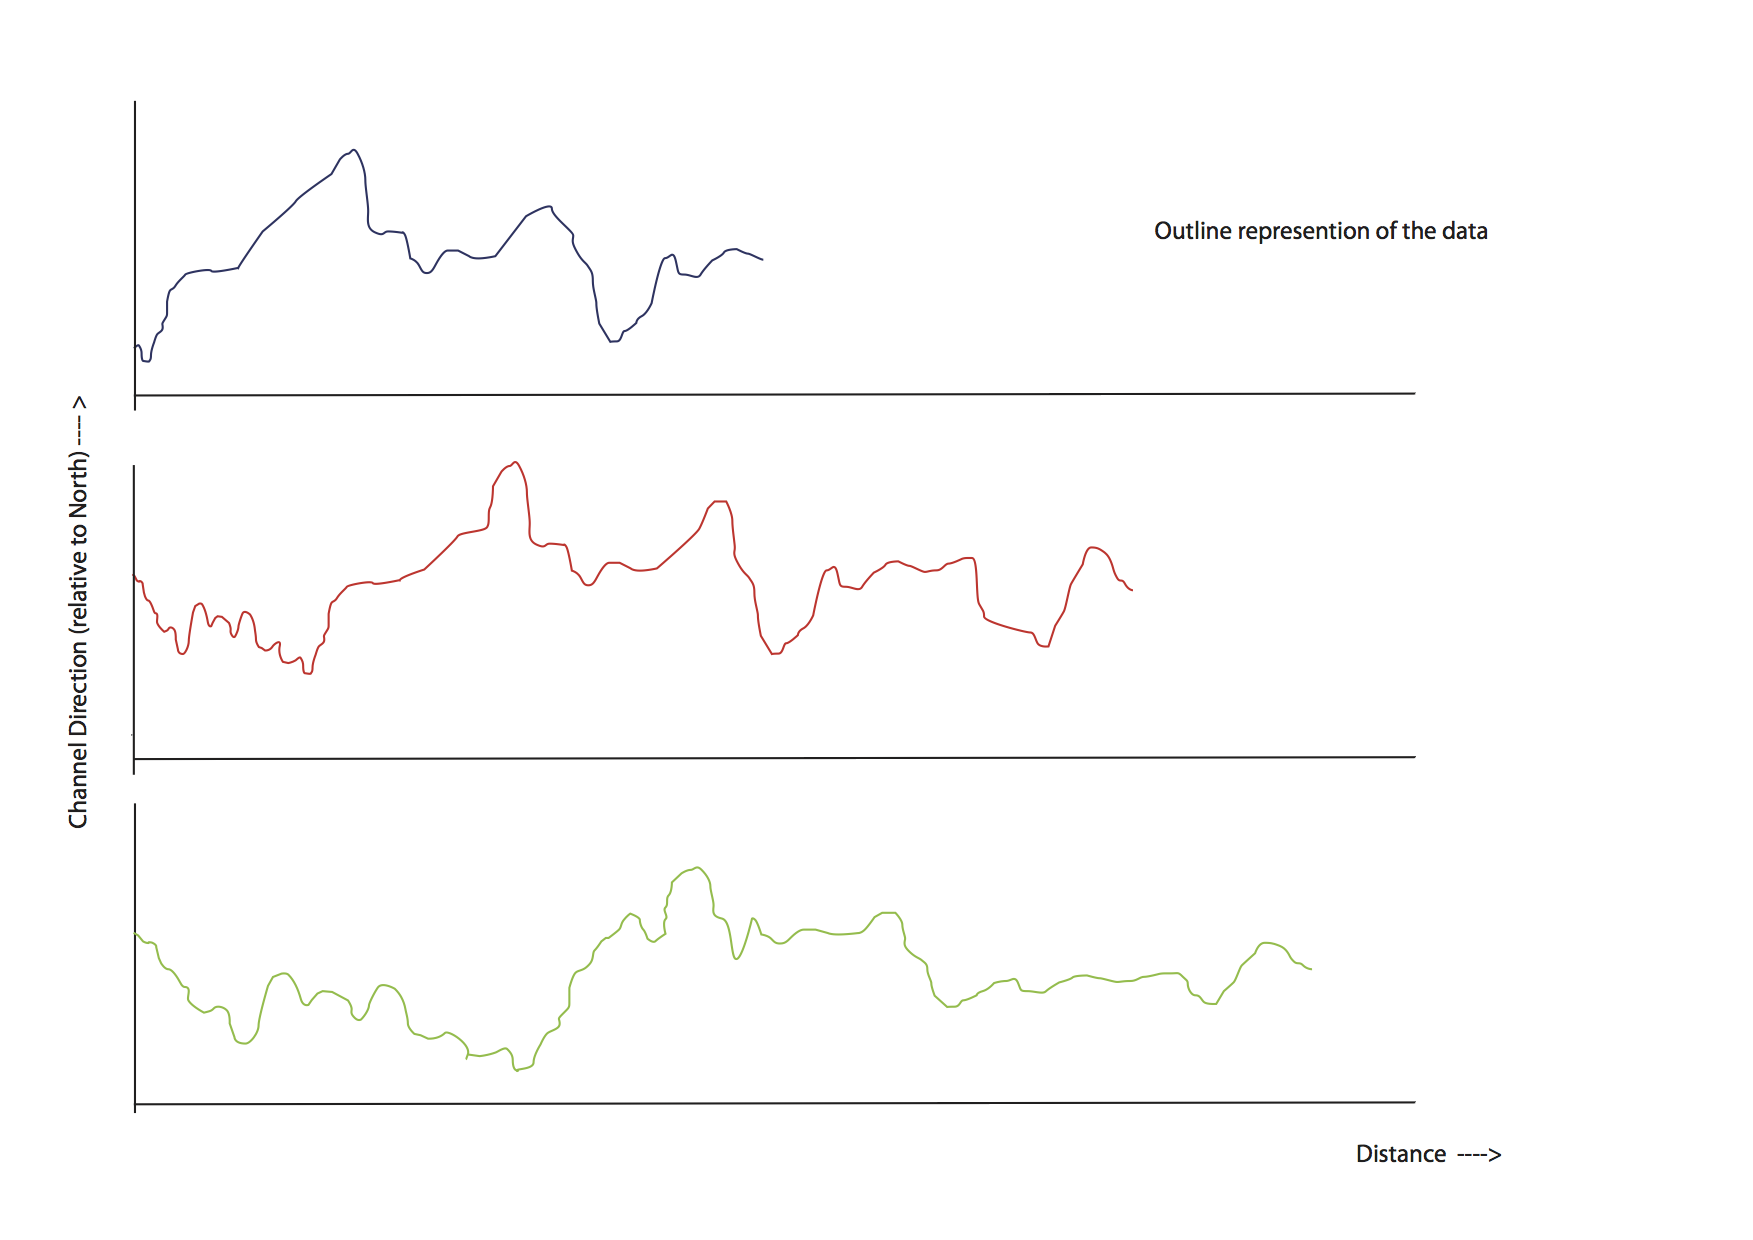
I have three bivariate data sets of different sizes and the same sampling interval. These represent the variation of dry river bed direction with distance at equidistant sample points. When plotted there are clear similarities between the datasets, the bends and their change in direction occur in the same order and magnitude, but some are delayed. I need to prove their equivalence in shape, I have considered co variance but what degree of matching can be demonstrated ? or I could correlate (?) data across the data sets to show equivalence but how to handle the differences in sample number and feature delay? I would appreciate some guidance please.
$\begingroup$
$\endgroup$
18
-
$\begingroup$ Do you have a single observation for each distribution? $\endgroup$– dv_bnCommented May 2, 2016 at 11:13
-
$\begingroup$ I am not sure what you mean, the distributions were determined from satellite images using manually plotted polygons and lines within ARCGIS. $\endgroup$– BrianknellCommented May 2, 2016 at 11:28
-
1$\begingroup$ Do you have three observations of the distribution of one single spatial process, a single observation for the respective distribution of three spatial processes, or many observations for the distribution of three spatial processes? Could you clarify with some notations, like... Let $t$ denote a spatial index. Let $F_i(x(t))$ be the distribution of a spatial stochastic process $x$ at location $t$ measured at time $i$. $\endgroup$– dv_bnCommented May 2, 2016 at 11:48
-
$\begingroup$ So you have a sample of observed distributions $F_x$, $F_y$ and $F_y$ for the three processes $x$, $y$ and $z$? Is the object of interest the covariance between those distributions? $\endgroup$– dv_bnCommented May 2, 2016 at 20:23
-
1$\begingroup$ Can you post your data, and maybe a plot? I still can't understand your situation. $\endgroup$– gung - Reinstate MonicaCommented May 4, 2016 at 13:28
|
Show 13 more comments
1 Answer
$\begingroup$
$\endgroup$
I used DTW with considerable success (the dtw Cran package). As I had only 6 distributions extra effort was required to generate randomised test profiles similar to the subject profiles to select the most appropriate settings and step pattern for the DTW algorithm.

