I'm trying to determine a method to compare one particular time series against about 10,000+ reference time series programmatically, and shortlist those reference time series which can be of interest.
The method I was using was Pearson Correlation. For each of the reference time series, I would calculate their correlation coefficients, and then sort the entire list of reference time series in descending order based on the correlation coefficient. I would then visually analyze the top N time series which have the highest correlation coefficients, which should be the best matches to the given time series.
The trouble is that I wasn't getting reliable results. Quite often the series in the top N range didn't visually resemble anything like the given time series. Finally when I read the complete article below I understood why: One can't use correlation alone to determine if two time series are similar.
Now this is a problem with all matching algorithms which calculate some sort of distance between two time series. For instance, the two groups of time series below can result in the same distance, yet one is obviously a better match than the other.
A => [1, 2, 3, 4, 5, 6, 7, 8,  9]
B1 => [1, 2, 3, 4, 5, 6, 7, 8, 12]
distance = sqrt(0+0+0+0+0+0+0+0+9) = 3
B2 => [0, 3, 2, 5, 4, 7, 6, 9,  8]
distance = sqrt(1+1+1+1+1+1+1+1+1) = 3
So my question is, is there a mathematical formula (like correlation) that can better suit me in these kind of situations? One which does not suffer from the problems mentioned here?
Please feel free to ask for any further clarification or improve the question text if needed. Thanks! =)
EDIT:

@woodchips, @krystian:
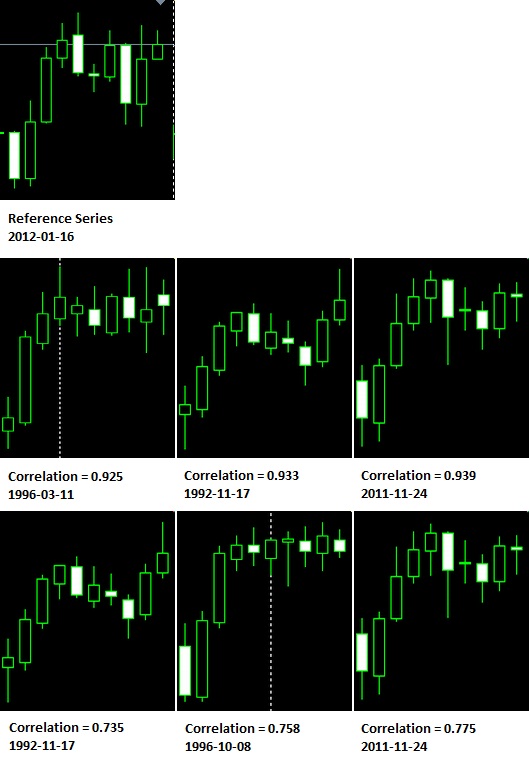
The top row shows the last ten bars of USDCHF-Daily ending at the given date. The second row gives the top 3 results of method A used for correlation (explanation will follow). The last row shows the top 3 results of method B. I've used High-Low-Close prices for correlation. The last images in each row are what I'd consider a "good match", the reason being that turning points in the series are more important to me. It's a coincidence that the last rows had the maximum correlation. But you can see in the last row that the second image is a very weak similarity. Still, it manages to sneak into the top 3. This is what disturbs me. Due to this behaviour, I'm forced to visually access each correlation and accept / discard it. The Anscombe's quartet emphasizes too that correlation needs to be visually inspected. That's why I wanted to move away from correlation and explore other mathematical concepts that evaluate series similarity.
Method A appends HLC data in one long series and correlates it with the given series. Method B correlates H data with reference H data, L with L, C with C, and then multiplies all three values to calculate net correlation. Obviously it reduces the overall correlation, but I feel it tends to refine the resulting correlations.
My apologies for responding so late. I was trying to gather data and code correlation and make graphics for the explanation. This image shows one of the rare events when the correlations are pretty spot on. I'll make and share graphics when the resulting matches are highly misleading too even though the correlation values are pretty high.
@adambowen: you're spot on. Actually I've implemented two different algorithms: correlation and dynamic time warping to access series similarity. For DTW I have to use MSE like you said. For correlation, I can use both MSE (in which case it is equal to the cost of DTW's diagonal route, without any warping) and the actual Pearson's correlation formula. The images below resulted from using Pearson's correlation formula. I'll look up the terms you mentioned in your post and report back soon. In actuality, I don't have two separate time series. It's just one time series almost 10,000+ points long. I use a sliding window of width N to autocorrelate the time series to locate the events when the series behaved similar to today. If I am able to find good matches, I might be able to forecast the movement of the present time series based on how it moved after each of the matches identified. Thanks for your insight.
