1
$\begingroup$

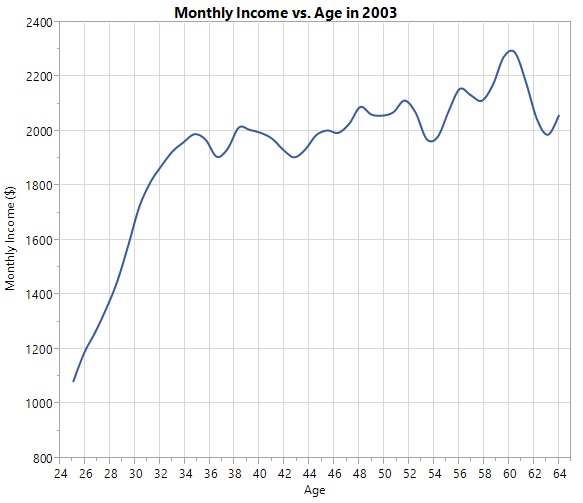
I have a dataset with several variables. The dependent variable is income, and the most important independent is age. I wish to model the relation between income and age, while taking into account other covariates. I have two questions: 1. How do I choose the right nonlinear model? I ask about nonlinear for two reasons: Theoretically, the relation should be quadratic. In my data, it looks exponential (image attached). 2. The sample is large, so small P-Values are likely. How do I evaluate the correctness of the model? In a t-test, I can always calculate the effect size. What is the effect size here? Should I use predictions? How do I know if a prediction is good or not?

enter image description here

Thank you !

$\endgroup$
3
  • $\begingroup$ Just to clarify, do you have multiple income curves like the one you show or does this curve is your final object you try to model? In addition is this income curve samples densely and regularly? (Say, at 20+ equally spaced points) $\endgroup$
    – usεr11852
    Commented Aug 10, 2016 at 13:48
  • $\begingroup$ I do have multiple, but I did not mention it. I wanted an answer in the simple case, where there is only one. Let's say I have y, x1, x2, x3,x4, where x1 is age and y is income. In reality, I have 10 dataset like this, one for each year, but this is a different problem. $\endgroup$ Commented Aug 10, 2016 at 13:50
  • 1
    $\begingroup$ A different problem warrants a different solution... Anyway, if you are interested in just a single curve, just follow Peter's advice (+1). It is a standard linear regression problem. If you feel really inclined you could also fit a spline or even use a local linear regression routine across time but that's probably an overkill for this task. $\endgroup$
    – usεr11852
    Commented Aug 10, 2016 at 13:54

1 Answer 1

2
$\begingroup$

A quadratic effect can be modeled in linear regression. Linear regression means that the regression is linear in the parameters, not in the variables. Just add a quadratic term for age. However, your data does not look quadratic; I suggest a spline model. One common choice is a restricted cubic spline of age.

As to how you know about how good your model is - all the standard methods. You can plot predicted values vs. actual; you can examine $R^2$ and its variants; you can compare AIC and other similar methods across models; you can say how reasonable it is based on substantive concerns; etc.

$\endgroup$
6
  • $\begingroup$ Thank you Peter. I will try reading into splines. Is there a way to add to such a model, a random effect? For example, if my subjects were sampled from families, and I may have 2 subjects from the same family? $\endgroup$ Commented Aug 10, 2016 at 13:57
  • $\begingroup$ Yes. Most programs that run multilevel models will allow for splines. $\endgroup$
    – Peter Flom
    Commented Aug 10, 2016 at 14:32
  • $\begingroup$ Do you have a recommendation to a package in R that does all that? $\endgroup$ Commented Aug 10, 2016 at 14:49
  • $\begingroup$ I think nlme does, but I am not sure. I am more of a SAS user $\endgroup$
    – Peter Flom
    Commented Aug 10, 2016 at 15:01
  • $\begingroup$ Oh, SAS is just fine. Can I do it with PROC nlmixed ? $\endgroup$ Commented Aug 10, 2016 at 18:29

Your Answer

By clicking “Post Your Answer”, you agree to our terms of service and acknowledge you have read our privacy policy.

Not the answer you're looking for? Browse other questions tagged or ask your own question.