1
$\begingroup$

Given a cross validated generalised linear model with about 5-10 coefficients across 10 folds, is it appropriate to plot all the coefficients on one graph using multiple line charts? That is:

  1. Have the folds numbered 1 to 10 on the x-axis.
  2. Plot a line chart for each model covariate, so that the y-value is the model coefficient for that covariate on the respective fold.

I would like to do this as it shows:

  1. How the model coefficients compare to each other in scale.
  2. The flatness of the line shows the stability of the coefficients to some extent.

What I do not like is:

  1. There is no linear relationship between the folds so a line chart would not be usually suitable; in other cases like this a scatterplot or bar plot would be preferred.
  2. The horizontal width of the plot artificially affects the flatness of the line.

Does anyone have any comments on this methodology or can recommend other ways of showing the cross validated coefficients?

$\endgroup$
2
  • $\begingroup$ Why not just a grouped or a faceted bar chart? As you rightly point out, the x-axis variable has no natural ordering for you to draw a line chart. $\endgroup$ Commented Aug 14, 2016 at 3:36
  • $\begingroup$ Mainly because I feel like for this purpose the bars take up a lot of chart space for not very good value for money, so to speak. I think I might try side by side box plots, even though I have some misgivings about using box plots to summarise 10 points worth of data. $\endgroup$
    – Alex
    Commented Aug 15, 2016 at 1:17

1 Answer 1

1
$\begingroup$

First, to add one more point to your list of drawbacks of the proposed plot: as the folds are (usually) drawn at random and interpreted to be random, there is no reason why fold 2 should be in between folds 1 and 3: the order along the x axis is also random.

Here is what I do:

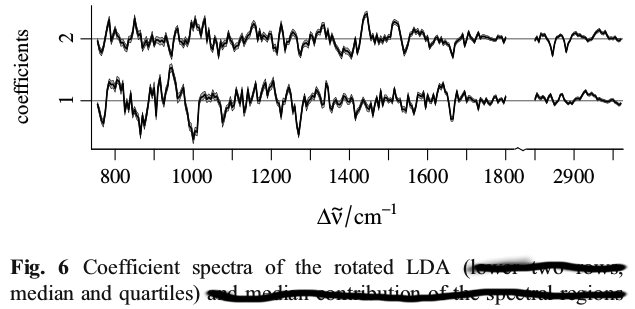
median and quartiles of model coefficients after iterated/repeated $k$-fold cross validation source: C. Beleites, K. Geiger, M. Kirsch, S. B. Sobottka, G. Schackert and R. Salzer: Raman spectroscopic grading of astrocytoma tissues: using soft reference information, Anal. Bioanal. Chem., 400 (2011), 2801 - 2816. DOI: 10.1007/s00216-011-4985-4
AAM version

Note that the data are spectra, so there is an inherent relationship between the variates that makes a line plot of the coefficients a sensible and common choice.
Also, that plot was produced from 125$\times$ repeated/iterated $8$-fold cross validation. An overlay plot of 1000 lines would have been a mess, so I plotted median and quartiles instead.

  • If the model (co)variates do not have such an inherent relationship lines are clearly not indicated. I'd preferrably go for facets unless that makes the plot too crowded.
  • If only few surrogate models were calculated, I'd go for a dot plot, with many surrogate models for a box plot or something similar.

  • If you facet (co)variates, and have an idea how the coefficient values are distributed, you could put QQ-plots into the facets.
$\endgroup$
2
  • $\begingroup$ Thanks for this chart. I am still trying to understand what it is; correct me if I am wrong. It seems to show the relationship between the value of the regression coefficients one and two for different spectra values on the $x$-axis, such that the black line is the median and the grey areas indicate the quartiles. Thus, this seems most similar to plotting a series of side by side box plots.... $\endgroup$
    – Alex
    Commented Aug 15, 2016 at 1:21
  • $\begingroup$ Yes that's right. Each of the measured wavenumbers $\Delta \tilde \nu$ ($\Delta$ because it is difference from excitation) has its coefficient. This is like some hundred boxplots side by side. Good quality spectra are continuous, and so are the coefficients. Thus, lines along x are allowed (otherwise I'd have used dots + error bars or boxes). $\endgroup$
    – cbeleites
    Commented Aug 16, 2016 at 6:41

Your Answer

By clicking “Post Your Answer”, you agree to our terms of service and acknowledge you have read our privacy policy.

Not the answer you're looking for? Browse other questions tagged or ask your own question.