1
$\begingroup$

I'm trying to do some hypothesis testing for work, but I have to admit that it's a bit trickier when you have to formulate the question yourself.

I have some data of the number of errors in a software we provide in the first 3 months after going live. I also have the number of those errors that are "critical errors". The hypothesis I want to test is that the number of critical errors in the first three months is equal to zero. I'm used to doing this in R, but my boss wanted it done in excel. Here's what I've got so far, but I'm not sure if I'm setting things up correctly:

Total Errors   | Criticals
     24        |     1
     31        |     0
      2        |     1
      8        |     3
      2        |     0
      0        |     0
      2        |     0
      4        |     0
      4        |     0
      5        |     0
      5        |     0
      9        |     0
      6        |     0
      7        |     1
      0        |     0
     12        |     0
     10        |     1
     13        |     0
     19        |     0
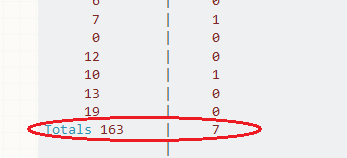
Totals 163     |     7
               |
s.e. criticals | 0.74059196
mean criticals | 0.04294479
h0             | 0
t-value        | 0.74032982
p-value        | 0.76991425

Sorry for the horrible format. I tried to copy it directly from excel. For SD and mean I just used excel's functions. I then calculated the t-statistic manually, and used excel's t-test function to find the p-value.

From what I've got so far I would say that I can't reject the null hypothesis that mean of critical errors in the first three months is equal to zero.

$\endgroup$
1
  • $\begingroup$ The "mean of the distribution of critical errors in the first three months" might be "equal to zero", but the critical error have non-zero values. They are not all zero. $\endgroup$ Commented Aug 21, 2016 at 17:41

1 Answer 1

1
$\begingroup$

pnuts' comment is correct.

If the true rate of critical errors is actually zero, you won't see a single one. (Even then, you can't prove the rate is zero, you can at best give an upper bound -- in a confidence interval sense -- on the rate.)

Conversely if you observe any critical failures in the three month period, you know for sure that the rate of critical failures cannot be zero.

extract of data from question showing "Total" row

Seven is more than 0. The rate of critical failures is not 0.

It's not clear to me why the other failures are relevant, but maybe you expressed the hypothesis of interest differently than you intended.

You might be able to do something similar to an equivalence test (but in this case only a single one-sided test would be needed). This would require specifying a proportion of total failures or a rate per unit time that is "practically" close enough to zero -- some sort of acceptable level of critical failures that you can demonstrate you're below (in effect, because a confidence interval for the parameter of interest would be contained inside the "acceptable region"). Your clients may have very different views from you on what rate of errors is acceptable, though.

An alternative would be to forget hypothesis tests or trying to give a bound on what's "acceptable" and just quote a one-sided interval for the parameter of interest. I wouldn't use t-statistics for that.

$\endgroup$

Your Answer

By clicking “Post Your Answer”, you agree to our terms of service and acknowledge you have read our privacy policy.

Not the answer you're looking for? Browse other questions tagged or ask your own question.