10
$\begingroup$

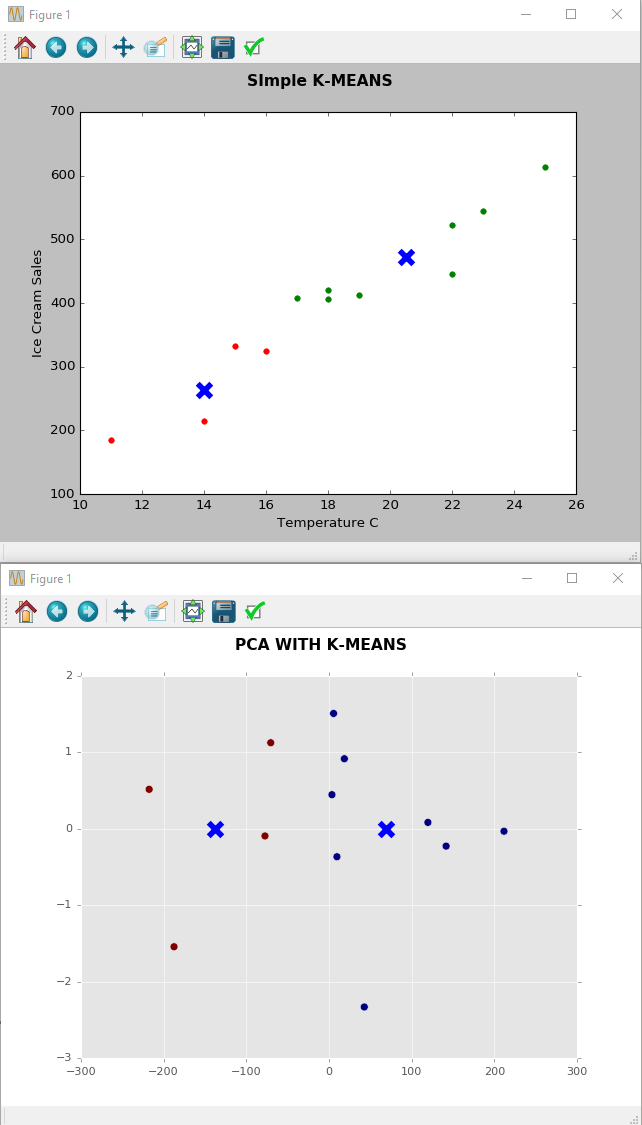
I'm taking a dummy data of temperature vs Ice cream Sales and categorized it using K Means (n clusters = 2) to distinguish 2 categories (totally dummy).

Now I'm doing a Principal Component Analysis on this data and my goal is to understand what I see. I know that PCA objective is to reduce dimensionality (obviously not in this case) and show variance of the elements. But how do you read the PCA plot below, i.e. what is the story you can tell about temperature vs the ice cream in the PCA plot? What do the 1st (X) and 2nd (Y) PCs mean?

enter image description here

$\endgroup$
1
  • 1
    $\begingroup$ This should be a comment, but I have insufficient rep. The link below is an excellent tutorial on PCA. Particularly, the Toy Example strikes a good balance between "simple enough to understand with one picture" and "complicated enough that it can be used as an analogy in future problems". I think reading it might help clear up what PCA can and can't do for you. cs.princeton.edu/picasso/mats/PCA-Tutorial-Intuition_jp.pdf $\endgroup$
    – Jason
    Commented Sep 22, 2016 at 4:19

2 Answers 2

18
$\begingroup$

I know that PCA objective is to reduce dimensionality

This is often what people assume, but in fact PCA is just a representation of your data onto an orthogonal basis. This basis still has the same dimensionality as your original data. Nothing is lost...yet. The dimensionality reduction part is completely up to you. What PCA ensures is that the top $k$ dimensions of your new projection are the best $k$ dimensions that your data could possibly be represented as. What does best mean? That's where the variance explained comes in.

obviously not in this case

I wouldn't be so sure about that! From your second plot, visually it looks like a lot of the information from your data can be projected onto a horizontal line. That's 1 dimension, instead of the original plot which was in 2 dimensions! Obviously you lose some information because you're removing the Y-axis, but whether this information loss is acceptable to you, is your call.

There are a ton of questions related to what PCA is on the site so I encourage you to check them out here, here, here or here. If you have other questions after that, please post them and I'd be happy to help.

As your actual question:

what is the story you can tell about temperature vs the ice cream in the PCA plot?

Since the new coordinate axes is a linear combination of the original coordinates, then...basically nothing! PCA will give you an answer like (numbers made up):

\begin{split} \mathrm{PC1} &= 2.5\times \text{ice cream} - 3.6\times \text{temperature}\\ \mathrm{PC2} &= -1.5\times \text{ice cream} + 0.6\times \text{temperature} \end{split}

Is that useful to you? Maybe. But I'd guess not :)

Edited

I'll add this resource which I think is helpful because interactive charts are cool.

Edited again

To clarify what best $k$ means:

PCA tries to find the dimensions that yield the highest variance when the data is projected onto them. Assuming your data has $n > k$ dimensions, the first $k$ PCs explain more variance in your data than any other $k$ dimensions can. That's what I mean by best $k$. Whether or not that's useful to you is another thing.

$\endgroup$
3
  • 6
    $\begingroup$ Also, be sure to scale variables. Otherwise sales (much higher numbers) will explain the majority of variance. Probably why the units in your PCs are so different. $\endgroup$
    – Filipe
    Commented Sep 21, 2016 at 20:31
  • $\begingroup$ Good answer, but your statement "... the best k k dimensions that your data could possibly be represented as ..." is perhaps over-generalized. The direction of maximum variance is not necessarily useful for separating two classes. Somehow, it often works out well, but not because PCA does anything to make the best choices for a particular purpose. $\endgroup$
    – Wayne
    Commented Sep 21, 2016 at 20:32
  • $\begingroup$ "in fact PCA is just a representation of your data onto an orthogonal basis." I am constantly surprised by the fact that many people do not understand this point... $\endgroup$
    – 3x89g2
    Commented Sep 21, 2016 at 21:51
5
$\begingroup$

To the good answer of Ilan man I would add that there is a quite straightforward interpretation of your principal components, although in this simple 2D case it doesn't add much to what we could have interpreted just looking at the scatterplot.

The first PC is a weighted sum (that is, a linear combination where both coeficients are positive) of temperatura and ice-cream consumption. In the right side you have hot days where a lot of ice-cream is sold, and in the left side you have colder days where less ice-cream is sold. That PC explains most of your variance and the groups you got match those two sides.

The second PC measures how temperature and ice-cream consumption moves away from the close linear relation underlined by first PC. In the upper part of the graph we have days with more ice-cream sold compared with other days of the same temperature and in the lower part days with less ice-cream sold than expected according to temperature. That PC explains just a little part of variance.

That is, we can tell a story from principal components, although with just two variables it's the same story we could have noticed without PCA. With more variables PCA becomes more useful because it tells stories that would be harder to notice otherwise.

$\endgroup$

Your Answer

By clicking “Post Your Answer”, you agree to our terms of service and acknowledge you have read our privacy policy.

Not the answer you're looking for? Browse other questions tagged or ask your own question.