12
$\begingroup$

Suppose I have the minimum, mean, and maximum of some data set, say, 10, 20, and 25. Is there a way to:

  1. create a distribution from these data, and

  2. know what percentage of the population likely lies above or below the mean

Edit:

As per Glen's suggestion, suppose we have a sample size of 200.

$\endgroup$
3
  • $\begingroup$ (1) is easy, because there are many solutions. (2) is best done in the context of some assumptions about the distributional shape, for otherwise all you can obtain are mathematical bounds. $\endgroup$
    – whuber
    Commented Sep 22, 2016 at 20:51
  • 3
    $\begingroup$ You're being taken literally here in comments and answers so far, but a necessary caution (tacit, I think, in @whuber's remarks) is that there are so many distributions compatible with such information that you should not infer that you have enough information to do this at all well or reliably. In particular, if you don't even know the sample size, you can't do much even to think about uncertainty. $\endgroup$
    – Nick Cox
    Commented Sep 22, 2016 at 22:17
  • $\begingroup$ When you ask about the proportion of the population that "lies above or below the mean" ... are you asking relative to the sample mean or population mean there? Are we talking about continuous or discrete variables? Do we know sample size? $\endgroup$
    – Glen_b
    Commented Sep 22, 2016 at 23:54

3 Answers 3

11
$\begingroup$

I have the minimum, mean, and maximum of some data set, say, 10, 20, and 25. Is there a way to:

create a distribution from these data, and

There are an infinite number of possible distributions that would be consistent with those sample quantities.

know what percentage of the population likely lies above or below the mean

In the absence of some likely unjustified assumptions, not in general - at least not with much sense that it will be meaningful. The results will depend largely on your assumptions (there's not much information in the values themselves, though some particular arrangements do impart some useful information - see below).

It's not hard to come up with situations where the answers on the proportion question may be very different. When there are very different possible answers consistent with the information how would you know which situation you're in?

More details may give helpful clues but as it stands (without even a sample size, though it's presumably at least 2, or 3 if the mean isn't halfway between the endpoints*) you won't necessarily get much of value on that question. You can try to get bounds, but in many cases they won't narrow things down a lot.

* actually if the mean is close to one endpoint you can get some lower bound on sample size. For example if instead of 10,20,25 for your min/mean/max you had 10 24 25 then $n$ would have to be at least 15, and it would also suggest that most of the population was above 24; that's something. But if it were say 10,18,25 it's much harder to get a useful idea of what the sample size might be, let alone the proportion below the mean.

$\endgroup$
13
  • 2
    $\begingroup$ @DJohnson I don't think it's hyperbolic -- it's quite literally true (though our ability to actually list them might fail after a few thousand and our ability to care to continue listing them might fail after a few dozen, it doesn't mean there are no other sets of assumptions we could operate under). There was no intent of condescension in my phrasing - it's deliberately chosen to actually indicate the true breadth of possible sets of assumptions. What would you like me to write? $\endgroup$
    – Glen_b
    Commented Sep 23, 2016 at 0:19
  • 3
    $\begingroup$ 1. What is a reason to restrict the possibilities to two parameters at most? What if the data were drawn from a three parameter lognormal, for example? In many cases we can't estimate all the parameters from the data, but that's part of the problem I am trying to motivate there (it relates to the discussion of assumptions. 2. Johnson and Kotz is a subset of what distributions people have named/worked with, not remotely a bound on what assumptions are possible. I've invented numerous distributions that are not in in Johnson and Kotz, and ... ctd $\endgroup$
    – Glen_b
    Commented Sep 23, 2016 at 1:34
  • 4
    $\begingroup$ ctd ... I'm pretty sure that they're not all ruled out here. Even with no unspecified parameters, there's an infinity of possible cdfs, a non-finite subset of which would not be ruled out by the specified information. $\endgroup$
    – Glen_b
    Commented Sep 23, 2016 at 1:34
  • 1
    $\begingroup$ @Djohnson Whatever the extent of any remaining disagreement, I appreciate your helpful comments. I will consider whether to at least more clearly indicate what I am really saying (my actual claim is capable of proof, were it needed, but perhaps I can at least state it clearly), and whether it should be differently phrased there. $\endgroup$
    – Glen_b
    Commented Sep 23, 2016 at 5:07
  • 4
    $\begingroup$ @DJohnson Take two different distributions fulfilling the conditions: any mixture of the two will still satisfy the said conditions. That's literally an infinity: a non enumerable one. $\endgroup$
    – Elvis
    Commented Sep 23, 2016 at 5:56
11
$\begingroup$

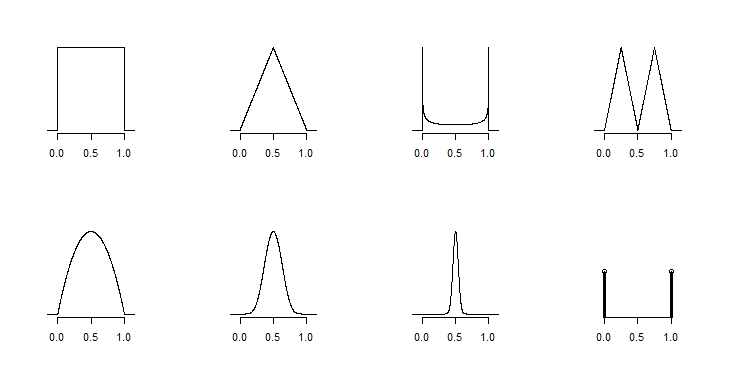
As already noted by Glen_b, there is infinitely many possibilities. Take a look at the following plots, they show eight different distributions that have the same min, max and mean.

Eight different distributions

Notice that they are very different from each other. First is uniform, forth is a bimodal mixture of triangular distributions, seventh has most probability mass concentrated around the center, but still min and max are possible with very small probability, eight is discrete and has only two values at min and at max, etc.

Since they all meet your criteria, you can use any of them for simulation. However your subjective choice would have very profound result on the outcome of simulation. What I want to say is that if min, max and mean is really the only thing that you know about the distribution, then you have insufficient information to conduct the simulation if you want it really to mimic the real (unknown) distribution.

So you need to ask yourself what do you know about the distribution? Is it discrete or continuous? Symmetric or skewed? Unimodal or bimodal? There is lots of things to consider. If it's continuous, non-uniform and unimodal, and you know only the min, max and mean, then one possible choice is triangular distribution -- it's highly unlikely that anything in real life has such distribution, but at least you are using something simple and not imposing too many assumptions about it's shape.

$\endgroup$
2
  • $\begingroup$ So if I did assume a triangular distribution I could calculate the mode as well with my current information. Would that help? $\endgroup$
    – user132053
    Commented Sep 23, 2016 at 19:41
  • 1
    $\begingroup$ @user132053 you need only min, max and mean. Formula for mean of triangular distribution is (a+b+c)/3 you can solve it for mode using simple arithmetic. $\endgroup$
    – Tim
    Commented Sep 23, 2016 at 20:18
5
$\begingroup$

A range-based rule for calculating the standard deviation is widely cited in the statistical literature (here is one reference ... http://statistics.about.com/od/Descriptive-Statistics/a/Range-Rule-For-Standard-Deviation.htm). Basically, it is (max-min)/4. It is known to be a very rough estimate.

Given that information and a willingness to assume normally distributed data, normal deviates can be generated from two numbers, the mean and the range-based std deviation. That said, any one or two-parameter distribution could be generated from these two pieces of information, as long as that distribution was rooted in the first or second moment.

A rough coefficient of variation could also be produced by taking the ratio of the SD/Mean. This would provide a proxy for the unitless variability in the data.

Error more properly refers to the sampling distribution of the population and requires a statement of the sample size, n, for estimation. Your description does not provide this detail.

$\endgroup$
2
  • 4
    $\begingroup$ Some things worth noting: (1) The mean potentially gives more information that should override the (max-min)/4 rule. (2) Since three pieces of information are given, using only a two-parameter family leaves on degree of flexibility in general. $\endgroup$
    – whuber
    Commented Sep 22, 2016 at 21:06
  • 1
    $\begingroup$ @whuber You've made two allusive comments on this thread. What would be great is if you were to elaborate on them and specify a response. $\endgroup$
    – user78229
    Commented Sep 22, 2016 at 21:16

Your Answer

By clicking “Post Your Answer”, you agree to our terms of service and acknowledge you have read our privacy policy.

Not the answer you're looking for? Browse other questions tagged or ask your own question.