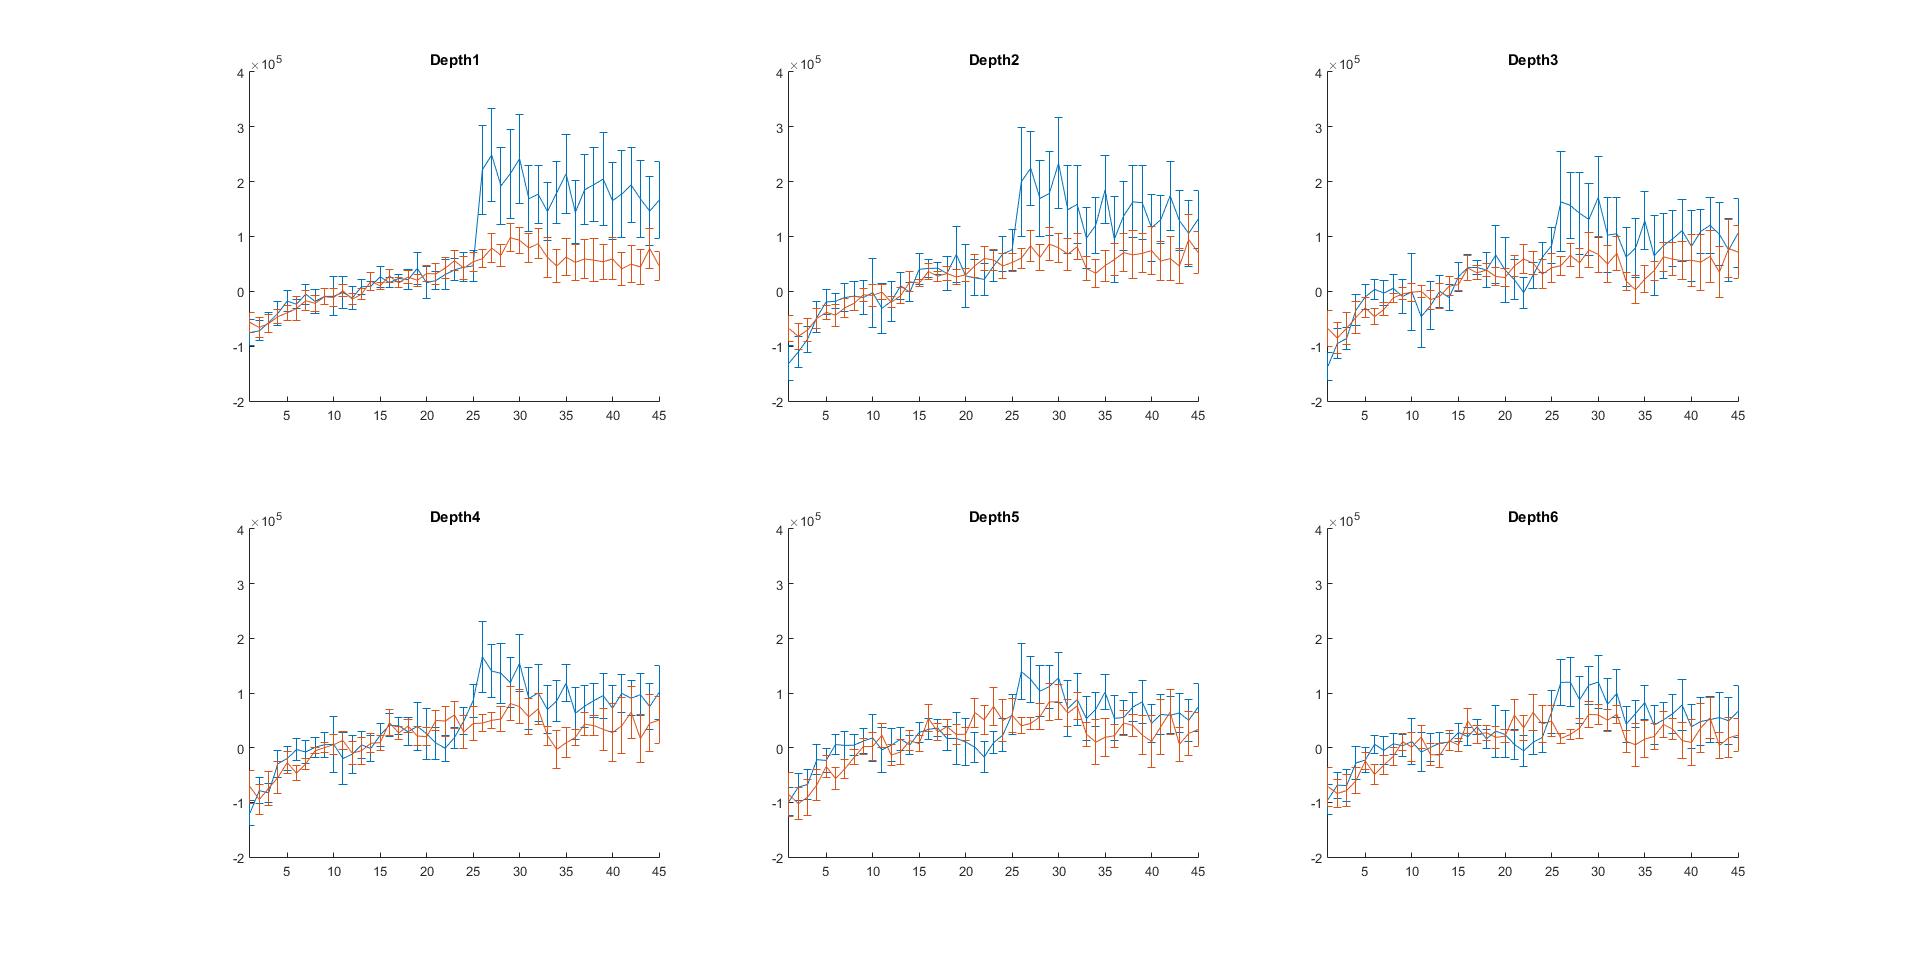
I think the easiest way to describe my question is with plots.

I've run an experiment where I recorded data from animals' brains (EEG) at 6 depths. The animals are recorded at baseline for 25 minutes, a treatment was applied, and then the animal was recorded after treatment for 20 minutes. These plots demonstrate the time course of our response measure of interest at each recording depth with the blue lines representing the treatment group mean and the orange line representing the sham group mean (n=9 for both groups). Each time point represents one minute of recording. Our method of EEG analysis provides one datapoint per 10 seconds, so each point here already represents an average of 6 timepoints.
It appears as if there is indeed an effect of treatment, and this effect is strongest in the more superficial depths. However, I am unsure as to the best way to test this statistically.
I've considered averaging the timepoints further, for example, creating one timepoint per every 5 minutes, and using repeated-measures ANOVA with depth and time as repeated measures. However, I'm unsure if this makes the best use of the large amount of data I've collected. Furthermore, I'm under the impression that repeated-measures ANOVA does not lend itself to post-hoc tests.
Is there another approach I might take in terms of analyzing time course data with a lot of timepoints?
If I do use repeated-measures ANOVA, is it canonically correct to use one "pretreatment" timepoint with multiple "posttreatment" timepoints? Clearly in this case, the sham and treatment groups differ very little pre-treatment. How many posttreatment timepoints is one generally "allowed" to use?
