6
$\begingroup$

I'm dealing with sales forecast for products in same category (f.i. all products belonging to $wine$ category). Data are time series with a daily frequency, $Y_{product_i} \in {0,1,2,..}$ . After some inspection I found out that time series models like Arima or Arimax do not fit particularly well my data and so I would like to try a new way.

I was considering, having count data, a Poisson Regression Model, which for a single product would look like this:

$Y_t|F_{t-1} \sim Poisson(\lambda_{t})$

$\lambda_t = \beta_0 + \beta_1*Y_{t-1} + \alpha_1*\lambda_{t-1} + \eta*X_t$

where $Y_t $ = sales at day t, $X_t$ = Exogenous regressors at day t.

My first question is:

Is there any package in $R$ implementing this? Is $glm$ sufficient?

Furthermore some products have very sparse time series while others sell always at least a couple of decades of items: would it be proper to consider log linear models in the second case and Hurdle models in the first one?

I was then considering the fact that I probably will need a more complex model which models a covariance structure between the sales of different products. Unfortunately I don't have much theoretical and Rpackages background in this case. I'm thinking about mixed effects models but I'm just wondering.. Basically I would like a Poisson Regression model with an autoregressive term for each of my products, but I don't know how to insert a covariance structure over the products. Should I go Bayesian?

$Y_{i_t} \sim Poisson(\lambda_{i_t})$

$\lambda_{i_t} = \beta_{0_i} + \beta_{i_1}*Y_{i_{t-1}} +\alpha_{1_i}*\lambda_{i_{t-1}} + \eta_i*X_{i_t}$

$i=1,..,numberofproducts$

So my second question is about finding theoretical perspective about multivariate time series count data together with packages in R.

$\endgroup$
2
  • $\begingroup$ Have you looked into Gaussian Cox processes? They may work nicely here, and can be fitted with the R package INLA (pdf) $\endgroup$ Commented Nov 7, 2016 at 13:53
  • 2
    $\begingroup$ arxiv.org/pdf/1405.3738.pdf This is the answer $\endgroup$ Commented Nov 9, 2016 at 21:00

1 Answer 1

6
$\begingroup$

I found a reference which answered my question: https://arxiv.org/pdf/1405.3738.pdf.

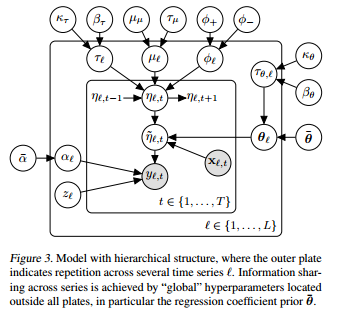
The model is quite complicated, here is the state space representation:

enter image description here

So, let's say I have L different products I'm studying across 1,..,T time periods.

$Y_{l,t} \sim z*\delta_0 + (1-z)NB(exp(\widetilde{\eta}_{l,t}),alpha_l)$ is the distribution for product l at time t

$\widetilde{\eta}_{l,t} = \eta_{l,t} + X_{l,t}\theta_l$ this is the Log of the mean of product l sales at time t, guaranteeing that it is positive.

$\eta_{l,t} = \mu_l + \phi_l(\eta_{l,t-1}-\mu) + \epsilon_{l,t}$

$\epsilon_{l,t} \sim N(0,\frac{1}{\tau_l})$

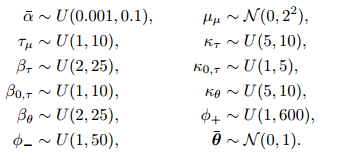
The other priors and hyperpriors are in the next images:

enter image description here enter image description here

P.S. Now I'm trying to write the JAGS code and any help would be much appreciated! ( https://stackoverflow.com/questions/40528715/runtime-error-in-jags )

Edit:

Here is the JAGS code:

model{


#hyperpriors 4
alpha_star ~ dunif(0.001,0.1)
tau_mu_star ~ dunif(1,10)
mu_star ~ dnorm(0,0.5)
beta_tau ~ dunif(2,25)
beta_0_tau ~ dunif(1,10)
beta_theta ~ dunif(2,25)
phiminus ~ dunif(1,50)
k_tau ~ dunif(5,10)
k_0_tau ~ dunif(1,5)
pointmass_0 ~ dnorm(0,10000)
k_theta ~ dunif(5,10)
phiplus ~ dunif(1,600)
theta_star ~ dmnorm(b0,B0)
#17
for (l in 1:L){
z[l] ~ dbeta(0.5,0.5)
phi[l] ~ dbeta(phiplus + phiminus, phiminus)
tau[l] ~ dgamma(k_tau,beta_tau)
tau_theta[l] ~ dgamma(k_tau,beta_tau)
mu[l] ~ dnorm(mu_star, tau_mu_star)
alpha[l] ~ dexp(alpha_star)
eps[1,l] ~ dnorm(0,tau[l])
eta[1,l] = mu_star + eps[1,l]
theta[l,1:8] ~ dmnorm(theta_star,thetavar*tau_theta[l])
#y[1,l] ~ inprod(1-z[l],dnegbin(exp(eta[1,l]),alpha[l]))
y[1,l] ~ dnegbin(exp(eta[1,l]),alpha[l])

#y[1,l] ~ dnegbin(exp(eta[1,l]),alpha[l])
ystar[1,l] ~ dnorm(z[l]*pointmass_0 + inprod((1-z[l]),y[1,l]),100000)
}

for (i in 2:N){

for (l in 1:L){
eps[i,l] ~ dnorm(0,tau[l])
}

    for(l in 1:L){
    eta[i,l] = mu[l]+ phi[l]*(eta[i-1,l]-mu[l]) + eps[i,l] 
    eta_star[i,l]= eta[i,l] + inprod(c(x[i,l],xshared[i,]),t(theta[l,]))
    #observations
#kobe[i,l] ~ dnegbin(dexp(eta_star[i,l]),alpha[l])
#   #y[i,l] = inprod(1-z[l],kobe[i,l])
    #y[i,l] ~ inprod(1-z[l],dnegbin(exp(eta_star[i,l]),alpha[l]))
    #y[i,l] ~ dnegbin(exp(eta_star[i,l]),alpha[l])
    y[i,l] ~ dnegbin(exp(eta_star[i,l]),alpha[l])
    ystar[i,l] ~ dnorm(z[l]*pointmass_0 + inprod((1-z[l]),y[i,l]),100000)
}
}

}

Which I call from R using runjags:

 parsamples <- run.jags('jags_model.txt', data=forJags, monitor=c('y','theta'), sample=100, method='rjparallel')
$\endgroup$
1
  • $\begingroup$ in this model there is a share of information which happens through the hyperparameters. I'm thinking about a vector $\mathbf{\epsilon} \sim N(0,\Sigma)$, so to model the covariance between the innovations. $\endgroup$ Commented Nov 11, 2016 at 14:00

Your Answer

By clicking “Post Your Answer”, you agree to our terms of service and acknowledge you have read our privacy policy.

Not the answer you're looking for? Browse other questions tagged or ask your own question.