4
$\begingroup$

In marketing segmentation studies which define clusters of consumers, categorical variables are often used to capture demographic and phychographic features, such as educational level, location, preferences, behaviors etc. So, in practice seemingly it makes sense to use categorical variables to cluster examples.

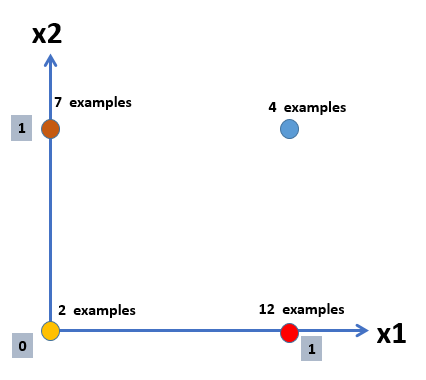
Let's use a very simple example for illustration purposes: Assume we define two events in a Web Analytics application: a) Download a PDF file (variable x1) and b) Sign in to the website (variable x2). Then let's assume that we have a distribution of examples as in the figure below:

enter image description here

In the above example, there is an intuitive way to cluster the observations: The 0–0 combination represents the less engaged users which form a cluster in themselves. The 1–0 and 0–1 combinations represent users somehow engaged to the website - and represent a second cluster. The 1–1 combination constitute the most engaged users and represent a third cluster. On the other hand, the Euclidean distance between combinations 0–1 and 1–0 which intuitively belong to the same cluster is larger than the lengths of the edges of the hypercube of possible combinations. Thus Euclidean distance does not seem a good metric in this case.

The question remains how we should perceive, interpret and explain distance and clustering when dealing with categorical dimensions and unlabeled data.

(Unsupervised clustering of unlabeled data is based on the premise that distance reveals patterns and that examples that are close together in the feature space and farther apart from other examples should be conceived as clusters. While this makes intuitive sense in a space of continuous features where Euclidean distance is relevant it is less intuitively apparent in a space formed by categorical binary features where the euclidean distance does not have a clear intuitive meaning. Then the question is, on what basis we perform clustering in such a space and what is the intuition behind it.)

$\endgroup$
4
  • 2
    $\begingroup$ I'm not voting to close despite I feel the question is "too broad" or "unclear what you are asking". Maybe you will want to put what bothers you, more specifically. Euclidean distance is seldom recommended for categorical data. Please search the site for clustering categorical data. In addition to that, I'd suggest you to read this thread. $\endgroup$
    – ttnphns
    Commented Dec 10, 2016 at 11:27
  • 1
    $\begingroup$ As well as following the suggestions of @ttnphns you might want to edit your post to give us some ideas you have had about methods. $\endgroup$
    – mdewey
    Commented Dec 10, 2016 at 13:26
  • $\begingroup$ Because space of categorical data is grainy (as you displayed) and not isotropic, euclidean distance is not often used. Dice measure (of binary measures) or log-likelihood distance (of entropy measures) are more suitable for nominal categorical features. Cluster analysis can be effectively done on such data, but it does have more limitations, some peculiarity, and has an issue with stability (see my comment to Anony-Mousse's answer). $\endgroup$
    – ttnphns
    Commented Dec 12, 2016 at 5:34
  • $\begingroup$ If dice measure or log-likehood distance is used in the above example what would be the result in terms of clusters? $\endgroup$
    – im7
    Commented Dec 14, 2016 at 20:52

2 Answers 2

4
$\begingroup$

I think you have things the wrong way around.

Unsupervised learning as you say just depends on distance, but the point is what representation do you choose; if two dimensions are somehow equivalent, you have to make it explicit. In your example since x1 and x2 mean similar things wrt customer engagement, you would do this by adding an additional feature x3 set to 1 if either x1=1 or x2=1.

For example if x1 was a categorical variable (eg item id for sales), you would add more variables expanding the item Id to brand id/price bucket etc... another example, say you have a variable hour of the day, - then depending on your problem, you might think of adding extra variables: work time/commuting time/ leisure time

Whatever makes 'intuitive sense' to you needs to be made explicit in the features.

No clustering algorithm (or other ML algorithm) can identify that separate dimensions mean similar things to people- it is the job of the statistician to set up the dimensions so that similar features are encoded similarly.

Although simple generic prescriptions for choosing the individual attribute dissimilarities $d_j(x_{ij} ; x_{i'j})$ and their weights $w_j$ can be comforting, there is no substitute for careful thought in the context of each individual problem. Specifying an appropriate dissimilarity measure is far more important in obtaining success with clustering than choice of clustering algorithm. This aspect of the problem is emphasized less in the clustering literature than the algorithms themselves, since it depends on domain knowledge specifics and is less amenable to general research.

Elements of statistical learning,section 14.3.3.

My italics, and to reiterate my interpretation, it is your job to choose dimensions of your pattern vector so that similar items in your domain (eg marketing) have small distance in your vector representation that you feed into the ML algo.

[EDITED]

$\endgroup$
3
  • $\begingroup$ I am not sure I understand your point. What you mean that two dimensions are "somehow equivalent"? That they both relate to a latent dimension such as "engagement" ? If this is what you mean what would you propose specifically in the example I cite? If not, could you please explain yourself better? Obviously, dowloading a PDF and "signing in" in a website are not equivalent, they represent different actions with different motivations. $\endgroup$
    – im7
    Commented Dec 14, 2016 at 15:54
  • $\begingroup$ But whatever dimensions one uses, once they are categorical -- binary more specifically -- would not he face again the same problem? Could you propose an example where this would not be the case -- if possible in the context of the situation I describe in my question? $\endgroup$
    – im7
    Commented Dec 14, 2016 at 21:02
  • $\begingroup$ @im7 You stated that "The 1–0 and 0–1 combinations represent users somehow engaged to the website - and represent a second cluster". It seems like seannv507 is saying that it's up to you to make this "intuition" explicit in a quantitative sense. $\endgroup$ Commented Dec 14, 2016 at 21:15
2
$\begingroup$

Indeed, distance-based approaches do not make a lot of sense on such data.

The idea of e.g. k-means is to gind groups of low variance, and that primarily makes sense on continuous data.

The popularity of these methods e.g. in marketing is probably best explained as follows:

  1. someone read that clustering is cool
  2. they loaded some data in some program that could run k-means or hierarchical clustering
  3. after a lot of fiddling, they even got a result
  4. the result didn't totally contradict their hypothesis, so they were happy and published it
  5. now everybody wants to do this.

The results don't need to be sensible, well-founded, or better than random for this to work. If you are eager enough to publish something, any method will do. Unfortunately.

If you have categoricial or binary data, a concept that makes much more sense is that of frequent patterns. But of course it's not as sexy (it boils down to counting, just as you did in your example... 1,0 is a frequent pattern). It's also less convenient, because some users may show more than one pattern, and many users will not have a typical pattern - so you don't get this nice "users of type A prefer blue jeans and spend 100$" type of nonsense that sells well as "result". And not so much black magic where you just can pretend that the clusters must be correct, because the magic algorithm found them.

$\endgroup$
2
  • $\begingroup$ I'm surprised with your (a clustering expert) scepticism about cluster analysis' application to categorical data. I wouldn't agree. A sensible selection of a distance measure and then clustering based on a method which support a measure might make up a valid CA for categorical data. Such an analysis will, inevitably, be a form of frequency patterns analysis. There is nothing wrong with CA of categorical data. The real issue with categorical CA, though, is stability of its solution (to case order). Quite often a not bad solution appears to be unstable. $\endgroup$
    – ttnphns
    Commented Dec 12, 2016 at 5:26
  • $\begingroup$ I agree that e.g. Jaccard + HAC is reasonable to try. But you will often get so many tied distances that you have little discrimination capabilities; in particular if you want an order-invariant result (beware that many linkages won't be order independent). But yes, I may have become rather cynical when seeing all the magic expectations on clustering, along with the various misuse, and the almost complete lack of theoretical support for published methods. $\endgroup$ Commented Dec 12, 2016 at 7:19

Your Answer

By clicking “Post Your Answer”, you agree to our terms of service and acknowledge you have read our privacy policy.

Not the answer you're looking for? Browse other questions tagged or ask your own question.