4
$\begingroup$

I conducted an experiment with 80 subjects, each of them performing 50 trials. I measured the time (in seconds) needed to accomplish each trial.

Trial-after-trial, every subject has the tendency to get faster in accomplishing his task. I can clearly see that there is a kind of "learning effect". By watching at some plots (x=trial_number, y=time), I can see a descending curve that looks like stabilizing towards an asymptotic minimum after the 20th trial.

I am looking for a statistical test that helps me stating, for example: "We observed that after an initial learning phase, from 28th trial the time to perform the task stabilizes on an average of 4.6 sec (sd=2.8)".

What kind of numerical analysis can I use to formally report on this effect? How do I "measure" the learning effect? Such test should be useful also in comparing the learning effect between two conditions, where the average time will be anyway on a different scale.

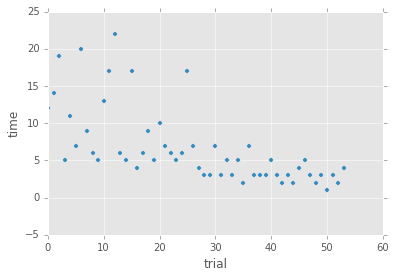
Following, an example of the behavior of a single subject. Time is measured with 1 second precision:

times to accomplish each trial for a single subject

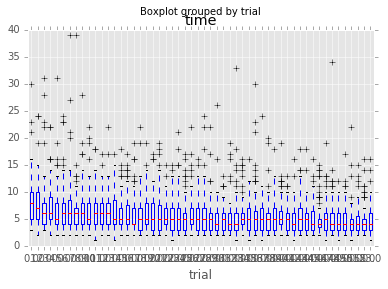
And here a progressive boxplot considering the trials of every user (sorry, temporary labeling). One can see a trend in diminishing the average time needed to accomplish a trial:

progression of the times needed to accomplish each trial from every user

$\endgroup$
9
  • 1
    $\begingroup$ Sounds like a longitudinal model. lme4.r-forge.r-project.org/book/Ch4.pdf $\endgroup$
    – Jon
    Commented Dec 12, 2016 at 19:07
  • $\begingroup$ Hi, Jon. I had a look at the document that you pointed. Indeed, the experimental design is the same, but I don't see any method useful to spot something like a "learning effect," i.e., the average of the measured values converging towards a horizontal asymptote after a training period. $\endgroup$
    – fnunnari
    Commented Dec 13, 2016 at 15:24
  • $\begingroup$ Can you include plots of the learning curves you're seeing? Trellis plots as in the pdf would be nice $\endgroup$
    – Jon
    Commented Dec 13, 2016 at 17:26
  • $\begingroup$ Jon, I updated the question to include a couple of clarifying screenshots. $\endgroup$
    – fnunnari
    Commented Dec 14, 2016 at 10:45
  • $\begingroup$ That's interesting. It looks like the learning curve follows 1/x pattern with come constant. You may want to look into nonlinear regression. From your plots it looks like you're using Python. I'm unaware of statsmodels capabilities for nonlinear regression, but you may find it more useful to work in R or matlab. $\endgroup$
    – Jon
    Commented Dec 14, 2016 at 20:08

1 Answer 1

4
$\begingroup$

You could take the mean value at each trial across subject and then fit a power curve using nls in R. Something like the following should probably fit pretty good:

pow.fun <- function(a, trial, k) a*trial^k
m <- nls(rt ~ pow.fun(a, trials, k), start = list(a = 25000, k = -.6))
plot(rt ~ trials)
lines(predict(m) ~ trials)

That will allow you to quantify the amount of learning. Even better, you might fit a few functions, maybe at least an exponential, and compare AIC values. Then you can say not only that you've quantified it but what kind of function it follows, among those you've tested.

Alternatively you could look up a Rescorla-Wagner based model and attempt to quantify things that way. If the experiment you're doing can be in some way mapped onto some kind of association learning that's your best bet. The R-W based models allow you to do things like state strength of association.

Just keep in mind though that it's well known that reductions in reaction times occur across trials (up to a point) in many paradigms. You don't need statistical tests to just say that the RT reduced and became stable. Just use the sentence that you have included in your question. It will be helped by the data more than anything so include a graph if you want. No test really helps you here because at best a test provides weak evidence against a null hypothesis that none of your readers would even remotely suspect was true anyway. When there isn't really a null hypothesis setting about trying to test one is misguided. You would only do the above if you want to quantify the learning and it's part of a larger program or something. For example, if you need to compare the amount of learning to some other method.

$\endgroup$
1
  • $\begingroup$ Thank you so much. This sounds both very useful and comforting :-) $\endgroup$
    – fnunnari
    Commented Dec 18, 2016 at 17:37

Your Answer

By clicking “Post Your Answer”, you agree to our terms of service and acknowledge you have read our privacy policy.

Not the answer you're looking for? Browse other questions tagged or ask your own question.