0
$\begingroup$

Here's my situation:

The equation for a simple linear regression model (below) was calculated and the summary output for the model was produced (below). The task is to calculate all equations by hand; however, for the sake of other users, I incorporated the data in R format too.

Linear Regression Model:

                     y = -0.76 + 1.21x

Data in R format

enter image description here

structure(list(x = c(74L, 77L, 79L, 84L, 95L, 98L, 112L, 120L, 
128L, 129L, 132L, 135L, 136L, 147L, 148L, 149L, 150L, 153L, 159L, 
161L, 161L, 163L, 197L), y = c(85L, 91L, 95L, 104L, 110L, 107L, 
134L, 146L, 169L, 156L, 165L, 166L, 169L, 172L, 173L, 189L, 182L, 
180L, 195L, 186L, 196L, 195L, 231L)), .Names = c("x", "y"), class =     "data.frame", row.names = c(NA, 
 -23L))

Question

Based on the linear regression model fitted, calculate estimates and 95% prediction intervals for the weight after 35 days for larvae weighing 128 mg initially and 200 mg initially. State which of the prediction intervals for x = 128 and x = 200 is the wider, and explain why it is wider.

Problem

I have attempted to calculate the prediction intervals for when x = 128 mg and x = 200 mg by hand, which will be used for further data analysis; however, my answers appear to be rather spurious. My main concern is that I feeling unsure about weather I plugged the correct values from the model summary output (below) into the prediction interval equations (below).

More specifically, I am unsure whether I should be multiplying either the standard error prediction or the standard deviation of the x-value with the t-value based on the 95 % prediction level with 21 degrees of freedom and what does the notation Sxx mean?

Inquiries

  1. What does Sxx stand for?
  2. Do you multiply the t-value with the standard prediction value or the standard deviation for the x-values?
  3. Does the notation for S in the prediction equation stand for standard prediction error or the standard deviation for the x values
  4. Which interval for x = 128 or x = 200 is wider?

If anyone can help by please providing advice, I would be deeply appreciative.

Equations

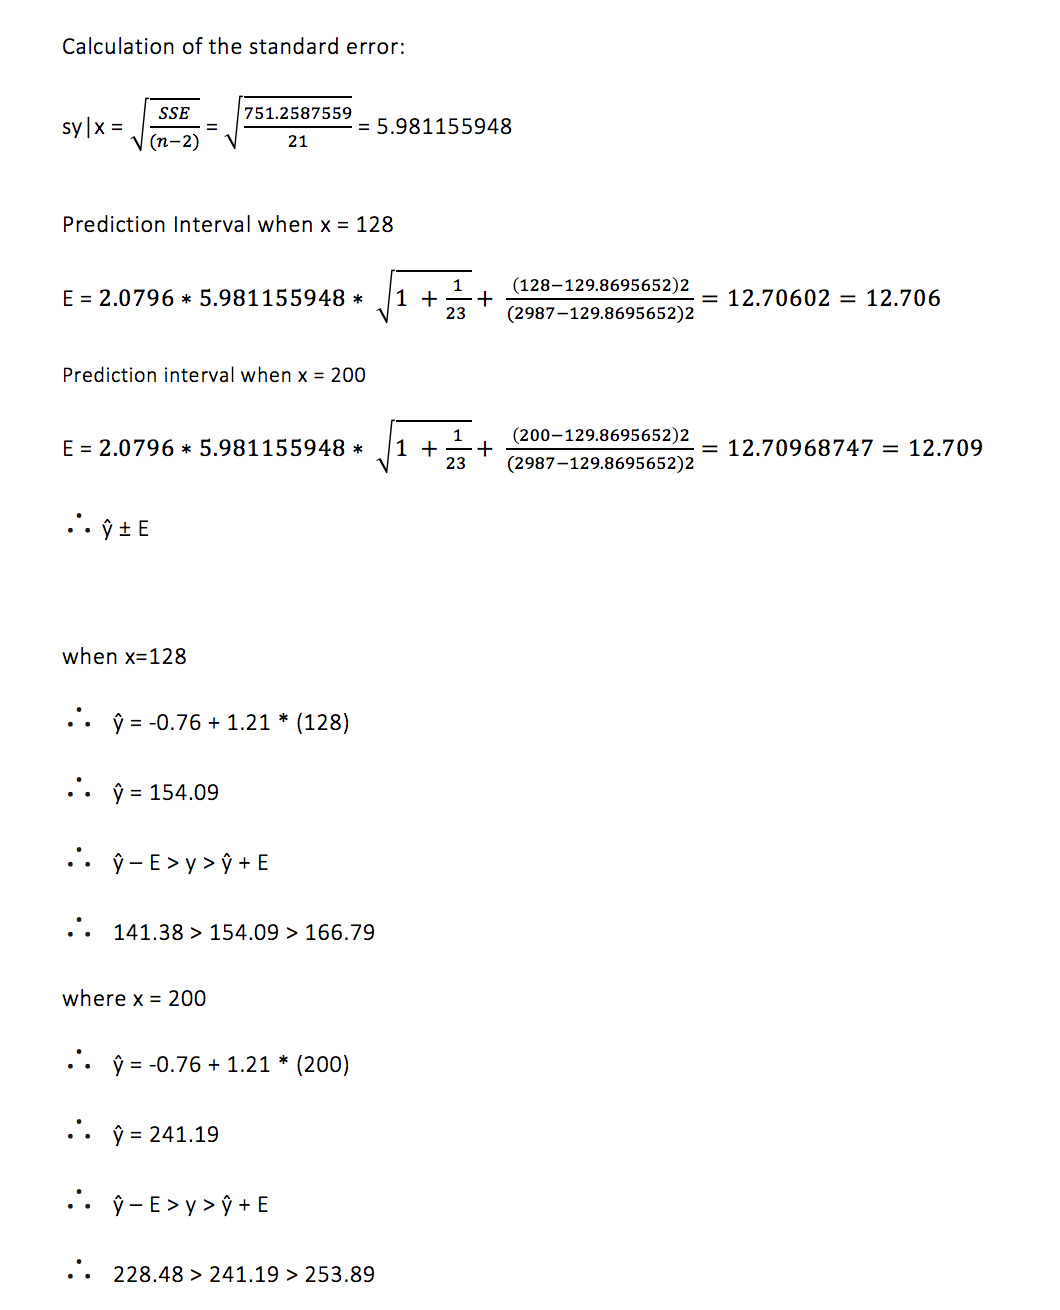
The answers (below) in the prediction interval equations appear to be wrong; therefore, the upper and lower boundary limits were used from the model summary output table to denote the margins above and below the y value.

enter image description here

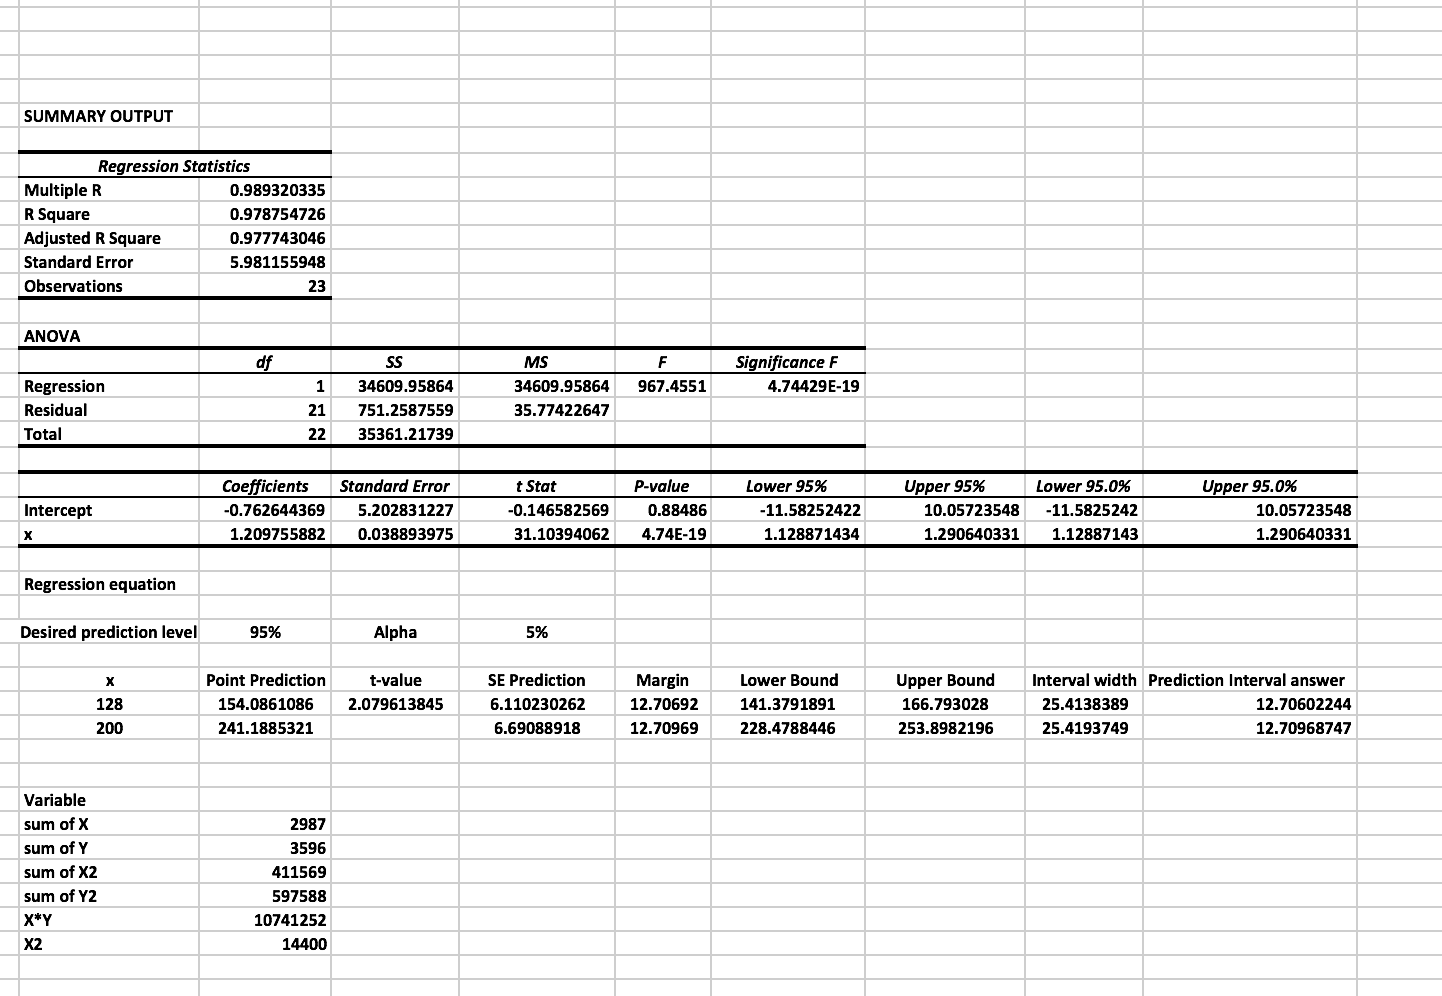
Model output:

enter image description here

$\endgroup$
1
  • $\begingroup$ Looks pretty good. Double check your arithmetic just to be sure. Finally, you might want to confirm your estimates using your favourite statistics program. Well done. $\endgroup$
    – user140401
    Commented Dec 28, 2016 at 10:26

1 Answer 1

1
$\begingroup$

We can use the regression estimates to predict the value of the dependent variable $\hat{y}$ for a given value of the dependent variable $x_g$. In introductory expositions of simple linear regression, the $100(1-\alpha/2)$ percent prediction interval is given by

$$ \hat{y} \pm t_{(1-\alpha/2)}s_{y|x}\sqrt{1+\frac{1}{n}+\frac{(x_g-\bar{x})^2}{\sum_i (x_i-\bar{x})^2}}$$

where $t_{(1-\alpha/2)}$ is the t score at $n-2$ degrees of freedom and $s_{y|x}$ is $\sqrt{MSE}=\sqrt{SSE/(n-2)}$.

What does Sxx stand for?

In some textbooks, you will see the same formula described as

$$ \hat{y} \pm t_{(1-\alpha/2)}s_{y|x}\sqrt{1+\frac{1}{n}+\frac{(x_g-\bar{x})^2}{S_{xx}}}$$

If so, then $S_{xx}=\sum_i (x_i-\bar{x})^2$. This might be the case in your notation, although you need to check this for yourself.

Do you multiply the t-value with the standard prediction value or the standard deviation for the x-values?

As seen above, you multiply the t-value with two terms, $s_{y|x}$ and the beast under the radical. In your question, I think that you are asking what $s_{y|x}$ means. If so, you can interpret $s_{y|x}$ as the square root of the estimated variance of $y$ given $x$. Thus, it is neither the standard prediction value not the standard deviation of the $x$ values. As given above, $s_{y|x}=\sqrt{MSE}=\sqrt{SSE/(n-2)}$.

In your case, I would

  1. Check $s_{y|x}$. In the formula given at the start, $s_{y|x}$ does not change. However, in the two equations of "E" in your worked example, you seem to have used two different values of $s_{y|x}$: 6.1102 and 6.69088. HINT: It is neither of the values you've entered. You're looking in the wrong place in your output.

  2. Check $\sum_i (x_i-\bar{x})^2$. In your worked example, you've used the value 32.79. This is waaaaaaayyy off. HINT: This value is not shown anywhere in your output. You will need to manipulate some values by yourself.

  3. Make sure you're extending the radical. Compare the formula you've displayed in your worked example with the first formula appearing above. The radical sign contains three terms.

You're very close.

Good luck to you.

$\endgroup$

Your Answer

By clicking “Post Your Answer”, you agree to our terms of service and acknowledge you have read our privacy policy.

Not the answer you're looking for? Browse other questions tagged or ask your own question.