When doing linear regression, all sorts of influence checks (Cook's Distance, leverage, dffits, dfbetas, covratio) can be conducted on the data points. Each of these are literature-supplied with some cut-off levels, i.e. Cook's D > 4/n. However, I am concerned with a special case: When a single data point drives the significance under the magic p=0.05 value. I see this in many life science regression plots. Not only the omission of a single data point would revert a regression from "significant" to "insignificant", but also small shifts of a single value can do this. Consider the following:
## Create significant model
set.seed(125)
a <- 1:20
b <- 5 + 0.08 * a + rnorm(20, 0, 1)
LM <- lm(b ~ a)
summary(LM)

Coefficients:
            Estimate Std. Error t value Pr(>|t|)
(Intercept)  5.01645    0.48052   10.44 4.59e-09 ***
a            0.09667    0.04011    2.41   0.0269 *

Residual standard error: 1.034 on 18 degrees of freedom
Multiple R-squared:  0.2439,    Adjusted R-squared:  0.2019
F-statistic: 5.807 on 1 and 18 DF,  p-value: 0.02688
If we simply exchange $b_1$ from its value (6.013) to 6.7, i.e. a mere shift of 10% of a single value out of 20, we obtain:
b2 <- b
b2[1] <- 6.7
LM2 <- lm(b2 ~ a)
summary(LM2)

Coefficients:
           Estimate Std. Error t value Pr(>|t|)
(Intercept)  5.15379    0.50033   10.30 5.65e-09 ***
a            0.08686    0.04177    2.08   0.0521 .

Residual standard error: 1.077 on 18 degrees of freedom
Multiple R-squared:  0.1937,    Adjusted R-squared:  0.1489
F-statistic: 4.325 on 1 and 18 DF,  p-value: 0.05213
Now researchers that are inclined to strictly adhere to the p=0.05 threshold might derive conclusions driven by a single datapoint. And IMHO, this shows that the data structure is highly unstable w.r.t. to significance. Furthermore, all classical influence measures fail to identify this data point #1 as an "outlier":
> influence.measures(LM2)
Influence measures of
lm(formula = b2 ~ a) :

     dfb.1_    dfb.a   dffit cov.r   cook.d    hat inf
1   0.74440 -0.63695  0.7451 1.053 2.57e-01    0.1857
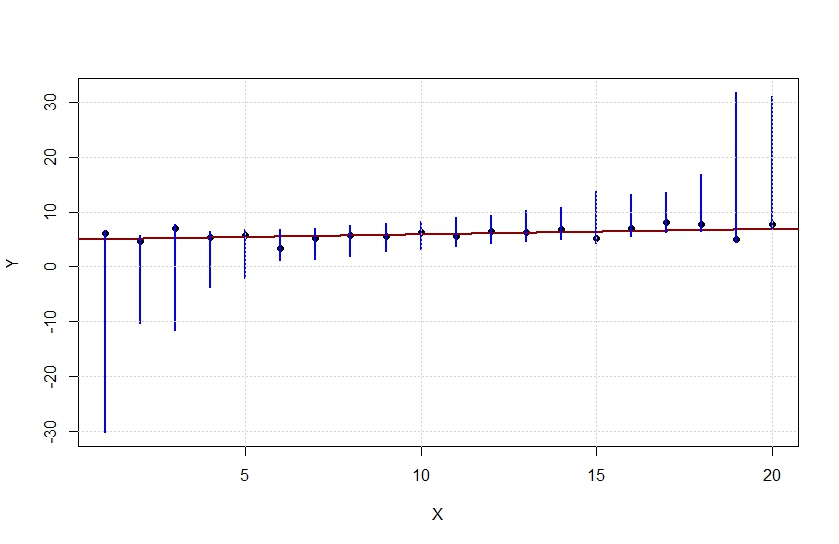
One can (by optimization) find, for each value, the "trust region" in which the complete regression stays significant (blue lines). Shifting any values (black points) outside any of these regions reverts significance, either by influencing the slope or its standard error in way that pt(slope/se(slope), n-2) > 0.05.
Question would be: Is this interesting stuff? Or am I missing some obvious and rather boring facts?

