3
$\begingroup$

I am studying time series using regression analysis. I know that when using time series data the assumption that the errors are independent cannot be satisfied.

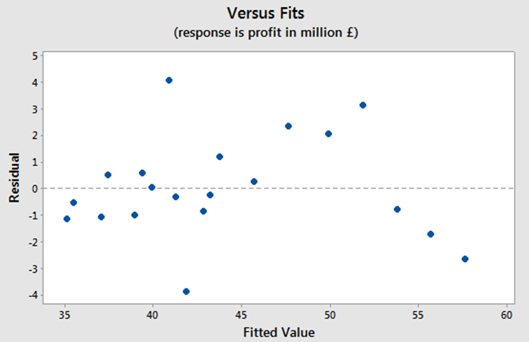
However, analysing the residual plot:

enter image description here

In my opinion, it does not have a positive autocorrelation because I cannot see a cyclic pattern. Also, it does not show a negative autocorrelation.

I think that there is a random pattern and it indicates that there is no autocorrelation or little autocorrelation.

I did a Durbin-Watson test to confirm the above ideas and the value for the test is 2.349. It is greater than 2 but very close to 2, so I assumed that there is no autocorrelation.

Additionally I checked that the p-values for the coefficients are very small, less than 5%. It means that they are all significant. enter image description here
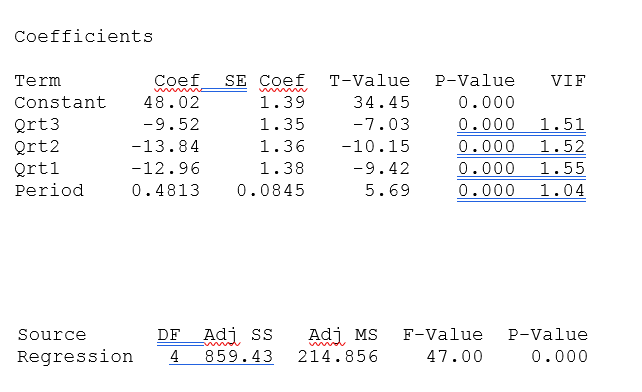
Also, the value for the F-test and p-values shows that the model is significant

All these, show that autocorrelation is not a problem in this case and that the assumption that the errors are independent are not being violated. However I am confused because I am using time series data where I used dummy variables for seasonality and according to what I read this assumption is not satisfied when using time series but in my case I think that there is no autocorrelation.

Can anyone help me on this?

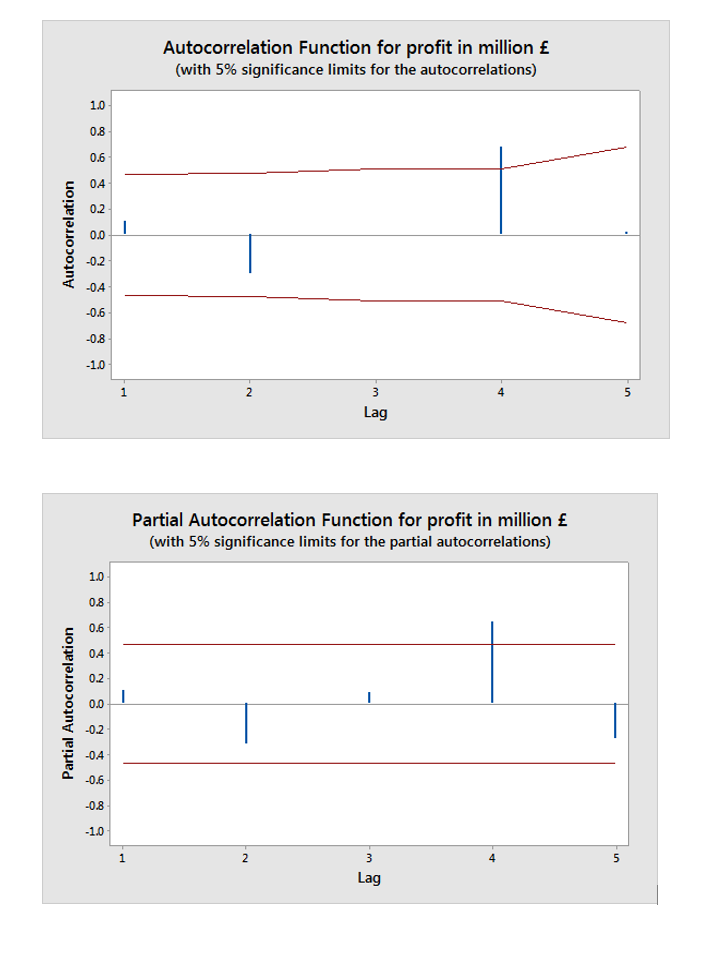
I edited my question to add the following plots of the ACF and PACF:

enter image description here

$\endgroup$
2
  • 1
    $\begingroup$ Did you take a look at the ACF and PACF plots of the residuals? If you can, post them. A raw plot of the residuals is not particularly helpful in identifying autocorrelation, and a plot of fitted vs residuals is not at all because there is no time ordering to the plot. $\endgroup$
    – Chris Haug
    Commented Mar 18, 2017 at 18:06
  • $\begingroup$ Hi, I added the autocorrelation plot and the Partial autocorrelation plot. I do not know how to interpret them. Can you please point me to a website where I can find more about this? So regarding what you said I cannot use the fitted values plot to see if there is or not autocorrelation? Also, the Durbin test is not enough to show that there is no autocorrelation as it is close to 2? $\endgroup$
    – user290335
    Commented Mar 18, 2017 at 18:19

1 Answer 1

6
$\begingroup$

The ACF/PACF results that you have added paint a much clearer picture of what is going on.

First, Durbin-Watson is a test of no autocorrelation against the alternative of AR(1) structure. If you look at your ACF/PACF, it's true, you don't see anything special at lag 1. However, it looks like you have something at lag 4.

Second, the fitted versus residual plot has no time structure whatsoever; the points are ordered by fitted value, not time. There is no autocorrelation information in this plot, whether it exists in the data or not.

Plots like ACF and PACF are a much better tool to diagnose autocorrelation, as well as more appropriate tests like Ljung-Box. What you can see in these particular plots is some kind of autocorrelation at lag 4, which is consistent with seasonality in a quarterly series. If the ACF/PACF you have shown are the raw series, then you probably expected this and that's why you included seasonal dummies. If the ACF/PACF are for the residuals, then your fixed seasonal dummies are not sufficient to take care of the seasonality.

$\endgroup$
2
  • $\begingroup$ It makes sense. I did not realise that the plot of residuals vs fitted values in this case was not useful. I will investigate more about the ACF/PACF plots to better understand the idea. I am confused about the Durbin test, because in my lectures, the only thing we learnt was the fact that if Durbin value was closer to 0, then there is a positive autocorrelation, close to 2 no autocorrelation and close to 4 there is a negative autocorrelation. I also have another question, if I plot the residuals vs order, it can be useful or should I only use the ACF and PACF plots? $\endgroup$
    – user290335
    Commented Mar 18, 2017 at 20:42
  • $\begingroup$ @user290335 Durbin-Watson does not test for "no autocorrelation" versus "any kind of autocorrelation". It summarizes the evidence about whether each residual is correlated to the residual that precedes it. You might expect autocorrelation to decrease monotonically with lag length, so that DW might look at the "worst" of the correlation, but that is not the case in this seasonal series: the autocorrelation at lag 4 is higher than lags 1-3. You can plot the time series of residuals and it will mean something, but most people can't eyeball the autocorrelation (for each lag). ACF/PACF is better. $\endgroup$
    – Chris Haug
    Commented Mar 20, 2017 at 12:26

Your Answer

By clicking “Post Your Answer”, you agree to our terms of service and acknowledge you have read our privacy policy.

Not the answer you're looking for? Browse other questions tagged or ask your own question.