5
$\begingroup$

Lets say I have 2 time series that look like this for a number of different test subjects:
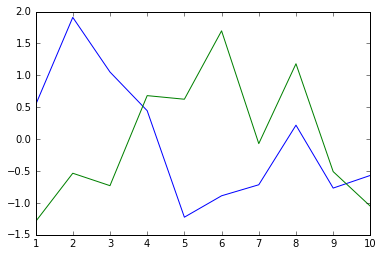
The lines represent values on 2 different metrics recorded at different points in time (minutes)

I have a prediction that says when the blue signal is high, the green will be low, and vice versa (i.e. they are inversely related). You can see this prediction play out between time points 1-7

I'm looking for a way to quantify the level of similarity (or I guess dissimilarity in this case) between the two signals, maybe some inferential test, to suggest that my prediction/hypothesis is correct. Are there any techniques designed for this type of analysis?

I've seen a few posts on here suggesting the use of a cross-correlation (e.g. Correlation between two time series), however, I dont think that would be useful in this case. A cross-correlation will tell me the maximum degree of similarity, and also the lag at which that similarity occurs. But I'm not really interested in similarity after time shifting because I only care about similarity as the data is recorded (lag 0)

I've tried a regular pearson correlation, but its resulting in really small correlation values. Are there any other methods that can help me determine whether my hypothesis is correct?

$\endgroup$
3
  • 2
    $\begingroup$ In Econometrics, cointegration analysis is often used for such analysis. Please check quora.com/… to see if it helps in this case. $\endgroup$
    – hssay
    Commented May 16, 2017 at 8:32
  • $\begingroup$ Thanks for that. From what I understand about cointegration analysis, it requires (or I guess assumes) that the 2 signals are cointegrated such that the distance between them at each time point is roughly similar? In my case that will rarely happen, especially given I'm expecting them to be negatively related - as one goes up, the other should go down, so at some point they will cross $\endgroup$
    – Simon
    Commented May 19, 2017 at 5:03
  • $\begingroup$ Sample cross correlations can have surprising sampling distributions, even under the null of no cross correlation: stats.stackexchange.com/questions/342335/… $\endgroup$
    – Taylor
    Commented Jan 30, 2019 at 4:17

2 Answers 2

0
$\begingroup$

First considering for a single subject. If we take each of the time points as independent, we should be able to state the hypothesis that for the equation $$ y = \beta_1 + \beta_2x $$ $ H_0: \beta_2 = 0 $
$ H_1: \beta_2 < 0 $

Fitting an equation to find our estimate for $\beta_2$ and the standard error in our estimate $se(\beta_2)$ we can find the $t$ statistic from $$ t = \frac{\beta_2}{se(\beta_2)} $$ The $t$ statistic can then be compared to tables of $t$ statistics.

For the case with many different subjects, it could depend on whether we need to take factors to do with the subjects out of the the problem, or whether we can bundle all of the data points into the model above.

Extensive reference here http://www.uv.es/uriel/4%20Hypothesis%20testing%20in%20the%20multiple%20regression%20model.pdf from page 5 onwards.

I hope I have understood the question correctly.

$\endgroup$
3
  • $\begingroup$ If I understand this correctly this is just a regression model predicting one time series from the other, and then t-testing the coefficient? As I mentioned, I did try a correlation type approach, but I'm not sure how much I trust the technique here as my beta values were really small and around 0.004. So I thought maybe a correlation/regression type approach may not be appropriate for this? $\endgroup$
    – Simon
    Commented May 16, 2017 at 18:29
  • $\begingroup$ I took from this "I have a prediction that says when the blue signal is high, the green will be low, and vice versa (i.e. they are inversely related)" that a regression model predicting one from the other would be the right way to go to test your hypothesis. Could each time in the time series be considered independent from the previous? If this isn't the case then the model I suggested may not be suitable. $\endgroup$ Commented May 17, 2017 at 12:45
  • $\begingroup$ hmm thats difficult to answer. one signal might be measuring walking speed at 10 consecutive minutes, so in that case you could say theyre not independent because the more someone walks the more tired they'll get. $\endgroup$
    – Simon
    Commented May 17, 2017 at 16:18
0
$\begingroup$

the simple cross-correlation doesn't make sense for two reasons 1) auto-correlation and 2) embedded/latent pulses/level shifts/seasonal pulses /local time trends thus it is possible to compute a robust cross-correlation using data adjusted for the embedded structure.

See my answer to How to quantify the effect of outliers when estimating a regression coefficient?

$\endgroup$

Your Answer

By clicking “Post Your Answer”, you agree to our terms of service and acknowledge you have read our privacy policy.

Not the answer you're looking for? Browse other questions tagged or ask your own question.