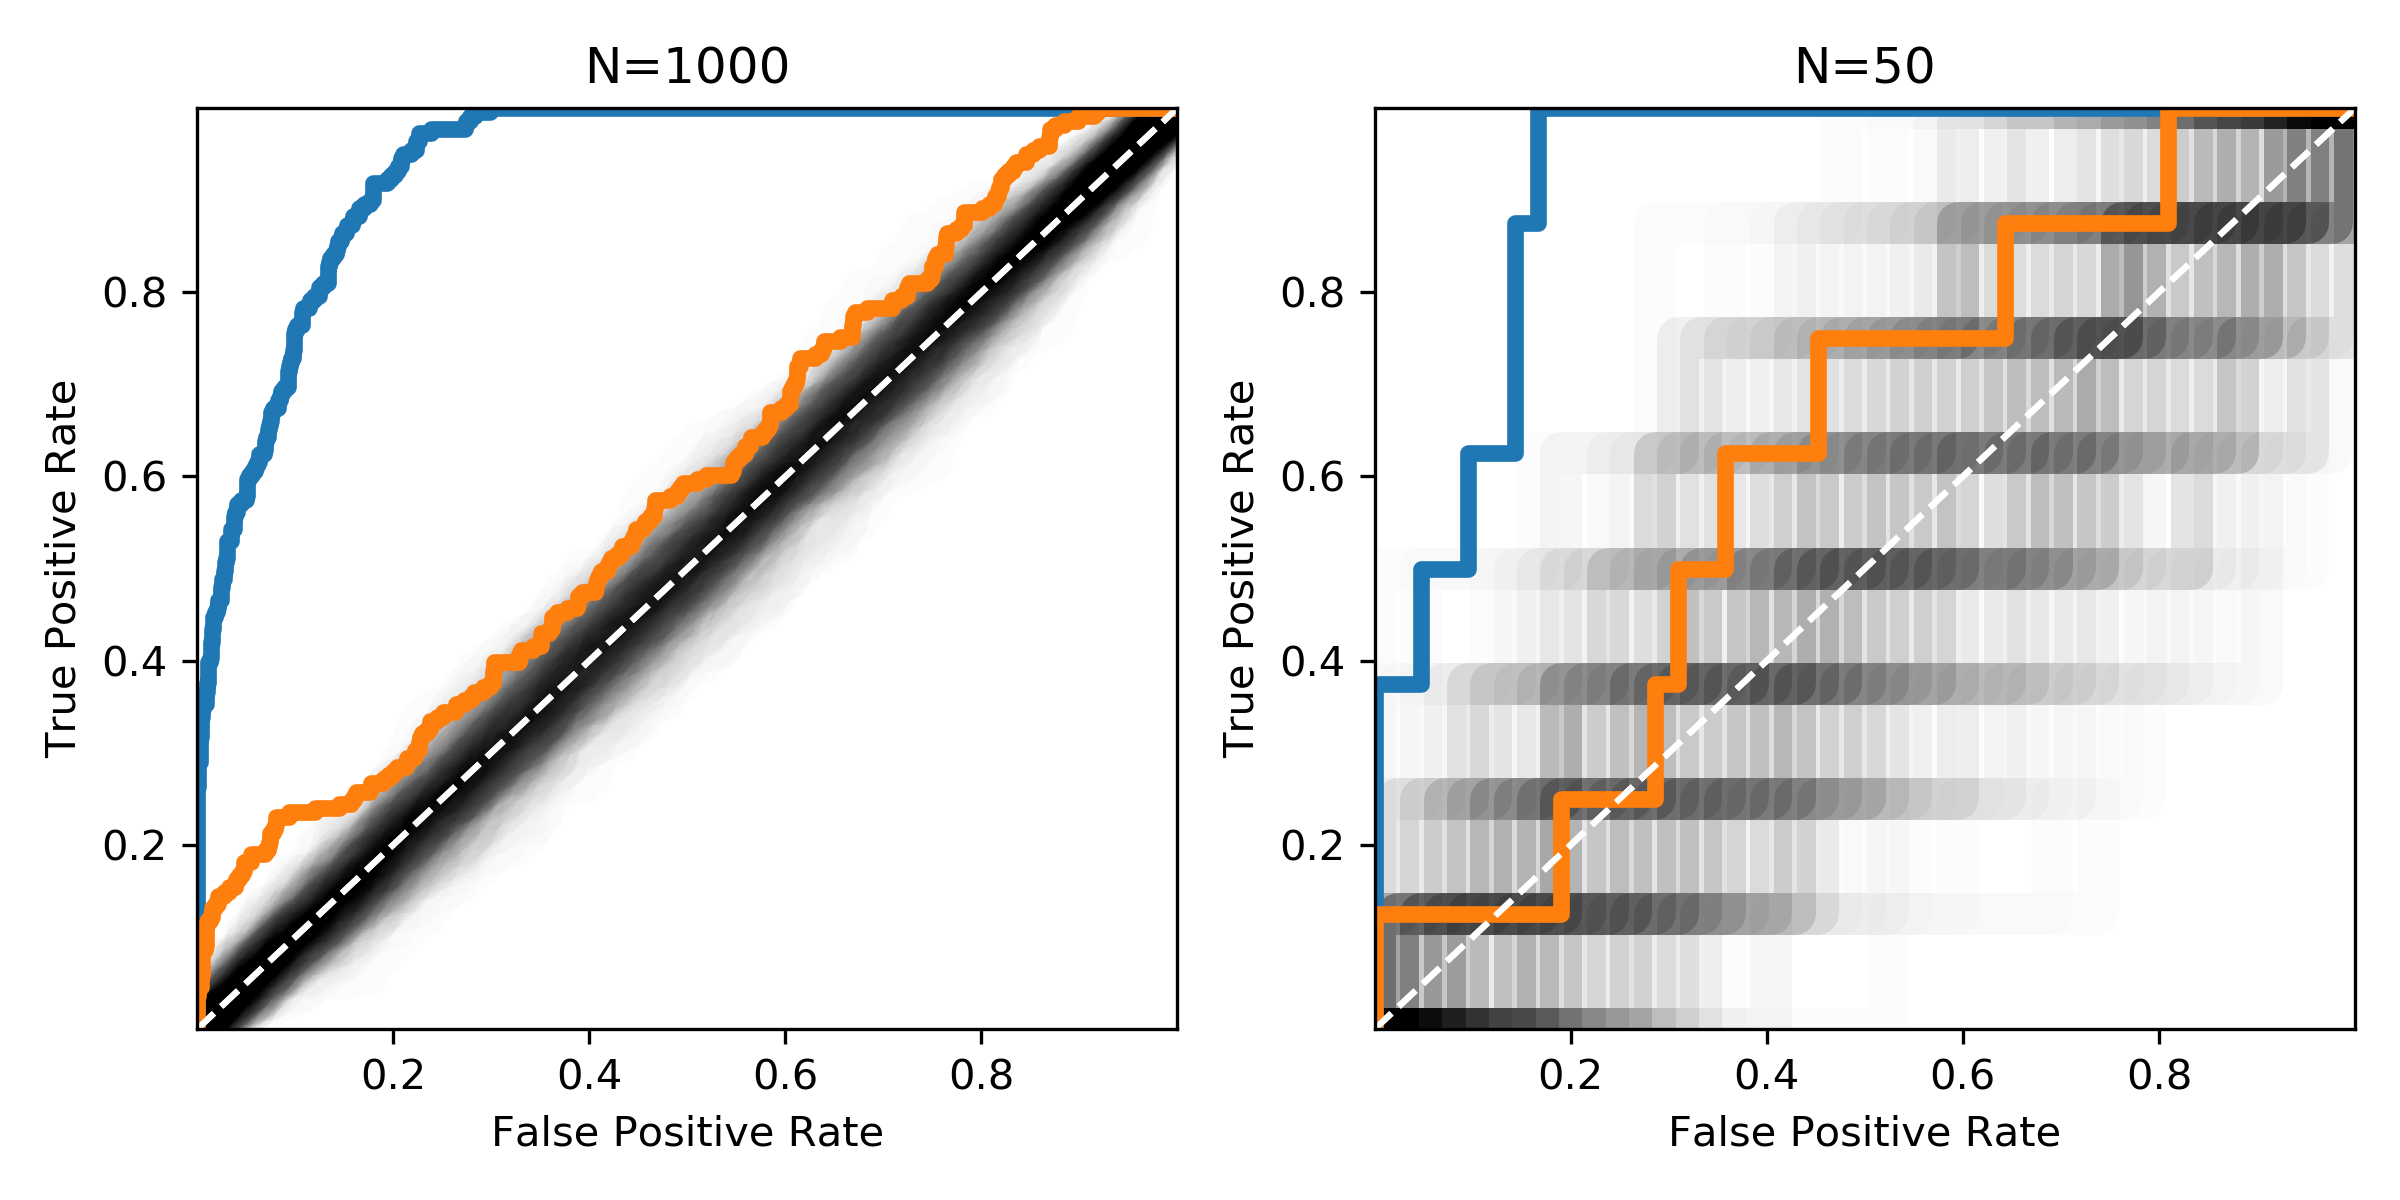
The AUC does not compare classes real vs. predicted with each other. It is not looking at the predicted class, but the prediction score or the probability. You can do the prediction of the class by applying a cutoff to this score, say, every sample that got a score below 0.5 is classified as negative. But the ROC comes before that happens. It is working with the scores/class-probabilities.
It takes these scores and sorts all samples according to that score. Now, whenever you find a positive sample the ROC-curve makes a step up (along the y-axis). Whenever you find a negative sample you move right (along the x-axis). If that score is different for the two classes, the positive samples come first (usually). That means you make more steps up than to the right. Further down the list the negative samples will come, so you move left. When you are through the whole list of samples you reach at the coordinate (1,1) which corresponds to 100% of the positive and 100% of the negative samples.
If the score perfectly separates the positive from the negative samples you move all the way from (x=0, y=0) to (1,0) and then from there to (1, 1). So, the area under the curve is 1.
If your score has the same distribution for positive and negative samples the probabilities to find a positive or negative sample in the sorted list are equal and therefore the probabilities to move up or left in the ROC-curve are equal. That is why you move along the diagonal, because you essentially move up and left, and up and left, and so on... which gives an AROC value of around 0.5.
In the case of an imbalanced dataset, the stepsize is different. So, you make smaller steps to the left (if you have more negative samples). That is why the score is more or less independent of the imbalance.
So with the ROC curve, you can visualize how your samples are separated and the area under the curve can be a very good metric to measure the performance of a binary classification algorithm or any variable that may be used to separate classes.

The figure shows the same distributions with different sample sizes. The black area shows where ROC-curves of random mixtures of positive and negative samples would be expected.

