1
$\begingroup$

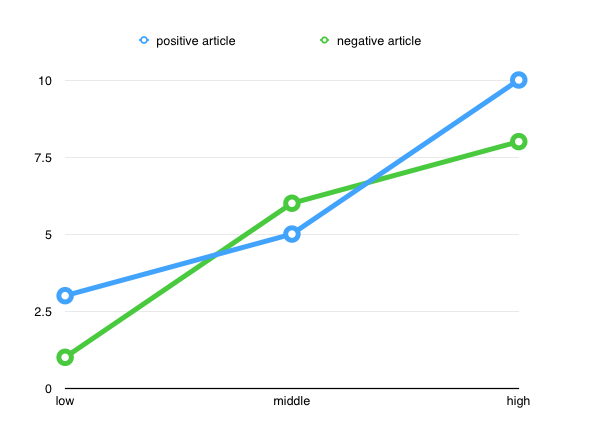
for my research I have a hypothesis containing a categorical IV (positive or negative article that the participants have to read) and a continuous moderator (ideology level of the participant). The x axis is the evaluation that participants are giving (by answering different questions on a 7-point-scala). On this following graph, you can see the interaction I'm suspecting (I further elaborate the concept in the last paragraph).

My question is, how can I write this down as a hypothesis if the moderator is continuous? It's clear to me how to do it when it's categorical and somehow I just seem to find examples of categorical moderators. I'm aware that the question might be really simple, but I'm really having trouble visualizing all this, as I imagine that I can't speak of 'low', 'moderate' and 'high' levels in my hypothesis? (again, the graph is only for visualizing, the moderator is continuous, even if I have 'divided' it in the graph). How do I highlight this interaction that is happening (or that I'm suspecting that it will happen) at the mid-level of ideology? If I'm just saying

enter image description here

I hope my question is clear and not too stupid :-)

Just a bit of context to understand my research: Participants will either read a positive or a negative description of the situation in a country before colonialism. For those having a middle level of ideology (so they are neither in favor of it, nor totally against it), they will evaluate colonialism more positive when they have read a negative article about the time before colonialism than when they have read a positive article. Now I suspect ideology to moderate this effect, when it's either on a low or a high level. For example, I suspect that participants with a high level of ideology will contest the article if it talks positively about the past (the past BEFORE the colonisation began). As a result, they will evaluate the colonial past HIGHER than in the situation where they read a negative article (and vice versa for the ones with a low ideology). How can I voice this without 'categorizing' my continuous variable with terms as low, middle, high?

$\endgroup$

1 Answer 1

3
$\begingroup$

What you're expecting is an interaction between article (pos or neg) and the quadratic effect of ideology. In other words, you're expecting that the curve of the ideology effect for positive article participants will differ from the curve for negative article participants.

Here's a model that would capture that hypothesis:

$DV = b0 + b1*ideology + b2*ideology^2 + b3*article + b4*article*ideology + b5*article*ideology^2 + e$

I'm assuming you'll dummy code article, and that you'll treat ideology as continuous. Your main hypothesis is that $b5$ will be significantly different from zero. From your plot, it looks like you're also expecting a linear effect of ideology (significant b1), and that you don't expect the linear effect of ideology to differ by article (non-sig b4), and you don't expect an overall main effect of article (non-sig b3). But those other aspects of the graph may not be central to your theory. You can run this model as multiple regression in your favorite statistical software.

Note that since you have seven levels of ideology, you would in theory be able to test polynomial terms up to a power of 6. In practice, I find anything about a cubic effect is pretty difficult to interpret usefully (especially when it's involved in interactions). You may want to test for those higher levels, though, to see if there's any non-linear effect you're not adequately capturing with the linear and quadratic effects. And, as always, plot and examine your residuals.

$\endgroup$
9
  • $\begingroup$ Thank you, that's very, very clear! Just one more question: If I'm running the model in a linear regression model, and find (as you guessed my prediction correctly ;-) ) that b3 and b4 are non significant. Is it better to run the model again without these two? And how can I see that I have 7 levels of ideology? $\endgroup$
    – Cheena
    Commented Jul 21, 2017 at 18:25
  • 2
    $\begingroup$ No, I'd leave b3 and b4 in the model no matter what because the interpretation of the higher order effects (like b5) depend on them being there. If you drop a main effect but keep an interaction with it, for example, you're actually modeling nesting, which is probably not what you want. $\endgroup$ Commented Jul 21, 2017 at 20:20
  • $\begingroup$ I'm not sure what you mean by "how can I see that I have 7 levels of ideology?" You're treating it as continuous, right? $\endgroup$ Commented Jul 21, 2017 at 20:21
  • 1
    $\begingroup$ You mentioned a "7-point-scala" (I assume you meant "scale") for ideology, meaning the data for that variable can range from, for example, 1 to 8. Although technically it's an ordered categorical variable, I agree with you that you should treat it as continuous. Nevertheless, it would be weird for you to go beyond 6 levels for a polynomial, since the data couldn't actually support any more fine-grained detail. I just meant to clarify that you could test polynomial terms from an order of 2 up to 6, but my recommendation would be to go to only 3 or 4. $\endgroup$ Commented Jul 22, 2017 at 20:06
  • 2
    $\begingroup$ Yes, dummy code article, and square ideology. Note that you'll want to center ideology before you square it, to avoid introducing multicollinearity. $\endgroup$ Commented Jul 25, 2017 at 18:23

Your Answer

By clicking “Post Your Answer”, you agree to our terms of service and acknowledge you have read our privacy policy.

Not the answer you're looking for? Browse other questions tagged or ask your own question.