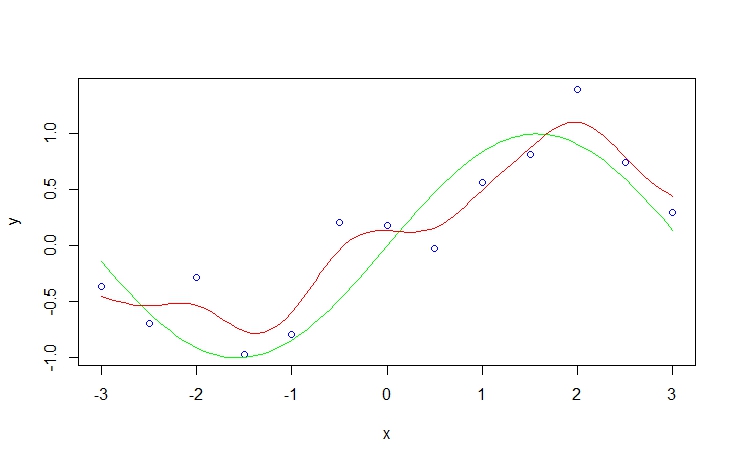
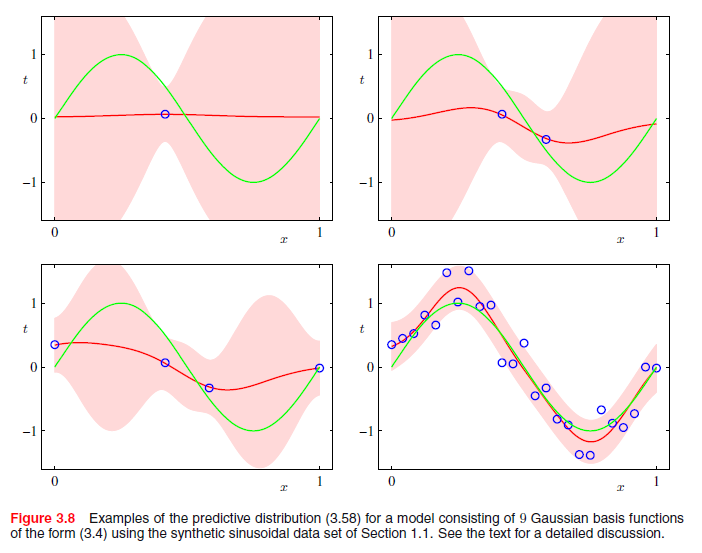
While the details are somewhat limited, and I do not have a copy of this text, this treatment more closely resembles a filtering process than a Bayesian linear regression. In fact, the suggestion to relax probabilistic interpretation precludes anything "Bayesian" about it at all. It's merely an optimization problem along the lines of: "Using a parsimonious linear combination of Gaussian wavelets, how can I best approximate whatever trend might underlie the joint x,y process?". There is a broad literature on filtering. It irks me somewhat that it is rarely discussed in its own right, as it is not an inherently Bayesian procedure.
Each $\phi_j(x)$ represents such a Wavelet. The mode/center occurs at $\mu_j$, it's width is determined by $s$ (relaxing the j subscript suggests this filtering process is constrained by not allowing Gaussian curves to be arbitrarily narrow). Not mentioned is a weight parameter $w_j$ which scales the Gaussian density vertically. It is assumed WLOG that the response is mean-centered so that it is not necessary to transpose the Gaussian curves vertically to achieve an optimal fit.
If $j$ is chosen to range from 1 to $n$, the resulting smoother from the filtering process fits each point perfectly. However, such a model is guaranteed to overfit the data, and this increases the bias, variance and thus the overall MSE of the resulting predictions. Therefore, using whatever preferred optimization approach you prefer, you can select $j < n$ to achieve a smoother which (hopefully) results in low MSE in external validation.
In R you can recreate the filtering by using the ksmooth procedure in the KernSmooth package. Specifically, the procedure implemented is the Nadaraya–Watson kernel regression, which is probably overly technical at this point.
library(KernSmooth)
set.seed(123)
x <- seq(-3, 3, 0.5)
y <- rnorm(length(x), sin(x), 0.4)
plot(x,y, col='blue')
curve(sin(x), add=T, col='green')
sy <- smth.gaussian(y, window=0.3)
do.call(lines, list(ksmooth(x, y, kernel='normal', bandwidth = 1)[c('x','y')], col='red'))


