I'm trying to generate a dataset with a pre-defined correlation between a normally distributed variable and a binary variable.
The method I had originally thought of was the following:
- Generate $X \sim Norm(0,1)$
- Generate $Y \sim Norm(0,1)$
- Generate $Q = \rho X + \sqrt{1-\rho^2}Y$, this will be the log-odds of success
- Generate $P = 1-\frac{1}{exp(Q) + 1}$, this is the probability of success
- Generate $U = Unif(0,1)$
- Generate $T = I(U < P) $
This method ensures that $Corr(X,P) = \rho$, however $Corr(X,T) \ne\rho$.
An alternative algorithm, replacing step 3 with:
- Generate $Q = \rho X$
provides similar results for $-1<\rho<1$, but in this second algorithm, we can take $\rho$ to be any value in $\mathbb{R}$, and still we have control of the correlation between $X$ and $T$.
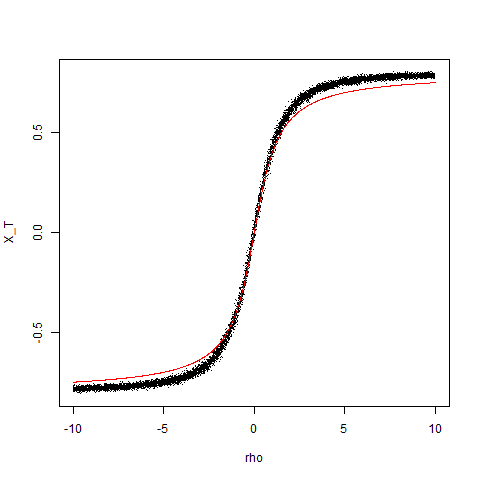
I ran this algorithm through R using different values of $\rho$ and plotted $\rho$ against $Corr(X,T)$ (using the default methods in cor.test):
After altering $\rho$, it appears that the correlation between the continuous and binary variable is bounded, approximately $-0.8 \le Corr(X,T) \le 0.8$. While trying to figure out a relationship between $\rho$ and $Corr(X,T)$, I thought it looked like an arctangent and so the red line is the plot of $1.6*tan^{-1}(\rho)/\pi$, which doesn't quite match. when using the first algorithm (and limiting $-1<\rho<1$), the relationship between $\rho$ and $Corr(X,T)$ appears to be linear, with $Corr(X,T) = 0.43\rho$
My first question is whether there is any literature or sources on explicitly finding the relationship between $\rho$ and $Corr(X,T)$? That way I can predefine this correlation, rather than $\rho$. And my second is whether this is the best way to simulate this kind of data? Note that in the work that I'm doing, there is a causal relationship between X and T (X -> T)


