5
$\begingroup$

We want to select one out of a given set of (continuous) functions that best matches a set of observations $\{(s_i,c_i) \mid 1 \leq i \leq N\} \subseteq\mathbb{N} \times \mathbb{N}$ (input size and counter) of unknown distribution. We have many observed counters per size¹.

So far, we have used least-square fitting on the average values per size. This obviously neglects any asymmetry in the data distribution (for a fixed size). Consider this example:
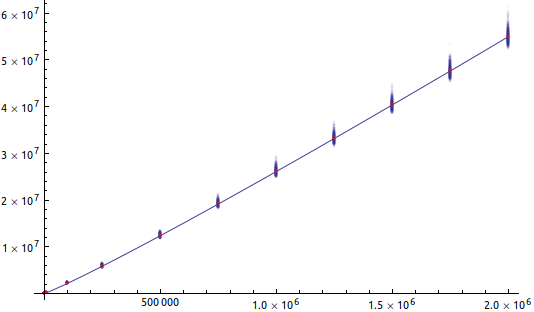
enter image description here

The blue blobs are the actually observed counters (one desaturated fleck per measurement, creating something like a violin plot), the red dots are the averages (per size) and the blue line is our estimation. Apparently, the actual measurements have some asymmetric distribution around the average.

Now we think that we can improve the result by fitting against all observations. This would increase the amount of data to be stored, transmitted and computed with a lot, so we would like to get around this. So this is our question:

Is there a statistic that can replace all observations per size without changing the result of least-square fitting, i.e. is there an $S : \mathbb{N}^\mathbb{N} \to \mathbb{N}$ such that

$\qquad \displaystyle \arg\min \sum_{i=0}^N (c_i - f(s_i))^2 \ =\ \arg\min \sum_{i=0}^{\max_j s_j} (S(C_i) - f(i))^2$

with $C_i = \{c_j \mid s_j = i\}$ for all (reasonable) functions $f$?

We would also be fine with using another criterion but least-square on the right hand side, as long as it is (about) equivalent (given $S$). Also, approximate equality is fine as long as we have equality in the limit (for $N$ and/or $\max_j s_j$ to $\infty$).


  1. We count how often a given algorithm hits a given basic block when executed on inputs of certain sizes. For an average case estimation, we run the algorithm on random sample of inputs per size.
$\endgroup$
1
  • $\begingroup$ Actually, we no longer think fitting against all points instead of the average is better for us since we want to fit the average runtime (in order to guess the expected runtime). It's still an interesting question. $\endgroup$
    – Raphael
    Commented Jul 27, 2012 at 12:43

1 Answer 1

1
$\begingroup$

It depends what "all reasonable functions" consists of. If you have a set of functions that is narrow enough that any function in the set can be fitted with only one data point on each $c$ value, then yes, there will obviously be some transformation $S$ that achieves this. The problem is, your setup does not tell you anything about how to construct this function $S$ other than by fitting the model with all the data points first. That defeats the purpose of the problem, since presumably you want a method that allows you to fit your model without all the data points, and still have some likelihood of having reasonable accuracy.

I would think that a better approach here would be to posit a well-specified class of models (e.g., linear regression, or some kind of GLM) and then see what happens if you estimate the regression line by using only a "representative" value of $s$ at each $c$ value (e.g., the sample mean). You could then derive results about how close this low-data method approximates the full model fit using all the data points.

(Also, as an aside, you say in your post that the blue dots have some symmetric distribution around the average. That does not seem to me to be consistent with the plot you have displayed; the plot shows evidence of positive skew in the vertical distribution of these points.)

$\endgroup$

Your Answer

By clicking “Post Your Answer”, you agree to our terms of service and acknowledge you have read our privacy policy.

Not the answer you're looking for? Browse other questions tagged or ask your own question.