This semester I am the teaching assistant for lecture with graded homework assignments. There are around 100 students, six assignments and nine tutors grading the submissions. Each homework gives the same number of points such that they all have the same weight.
Several years ago each tutor would grade the homework of the students in their tutorials. We realized that this likely is unfair as tutors have different levels of strictness. Therefore we randomly assign the submissions to the tutors for each assignment. With more tutors than assignments the chances should be good that they get a different tutor for each assignment.
Now I would like to see whether this method is sufficiently fair. My concrete questions are:
- Is there a measurable difference between the grading styles of the different tutors?
- Do all students on average have a fair result or did students get graded more strict than others?
For the first question I have figured that the ANOVA is the sensible method. I have started with the simplest model: Points ~ Tutor. This is the syntax of R's lm function and means that the dependent variable Points can be explained by the independent variable Tutor.
The output of the ANOVA is the following:
Analysis of Variance Table

Response: Points
           Df  Sum Sq Mean Sq F value    Pr(>F)
Tutor       8  145.89  18.236  6.5267 4.646e-08 ***
Residuals 447 1248.94   2.794
---
Signif. codes:  0 ‘***’ 0.001 ‘**’ 0.01 ‘*’ 0.05 ‘.’ 0.1 ‘ ’ 1
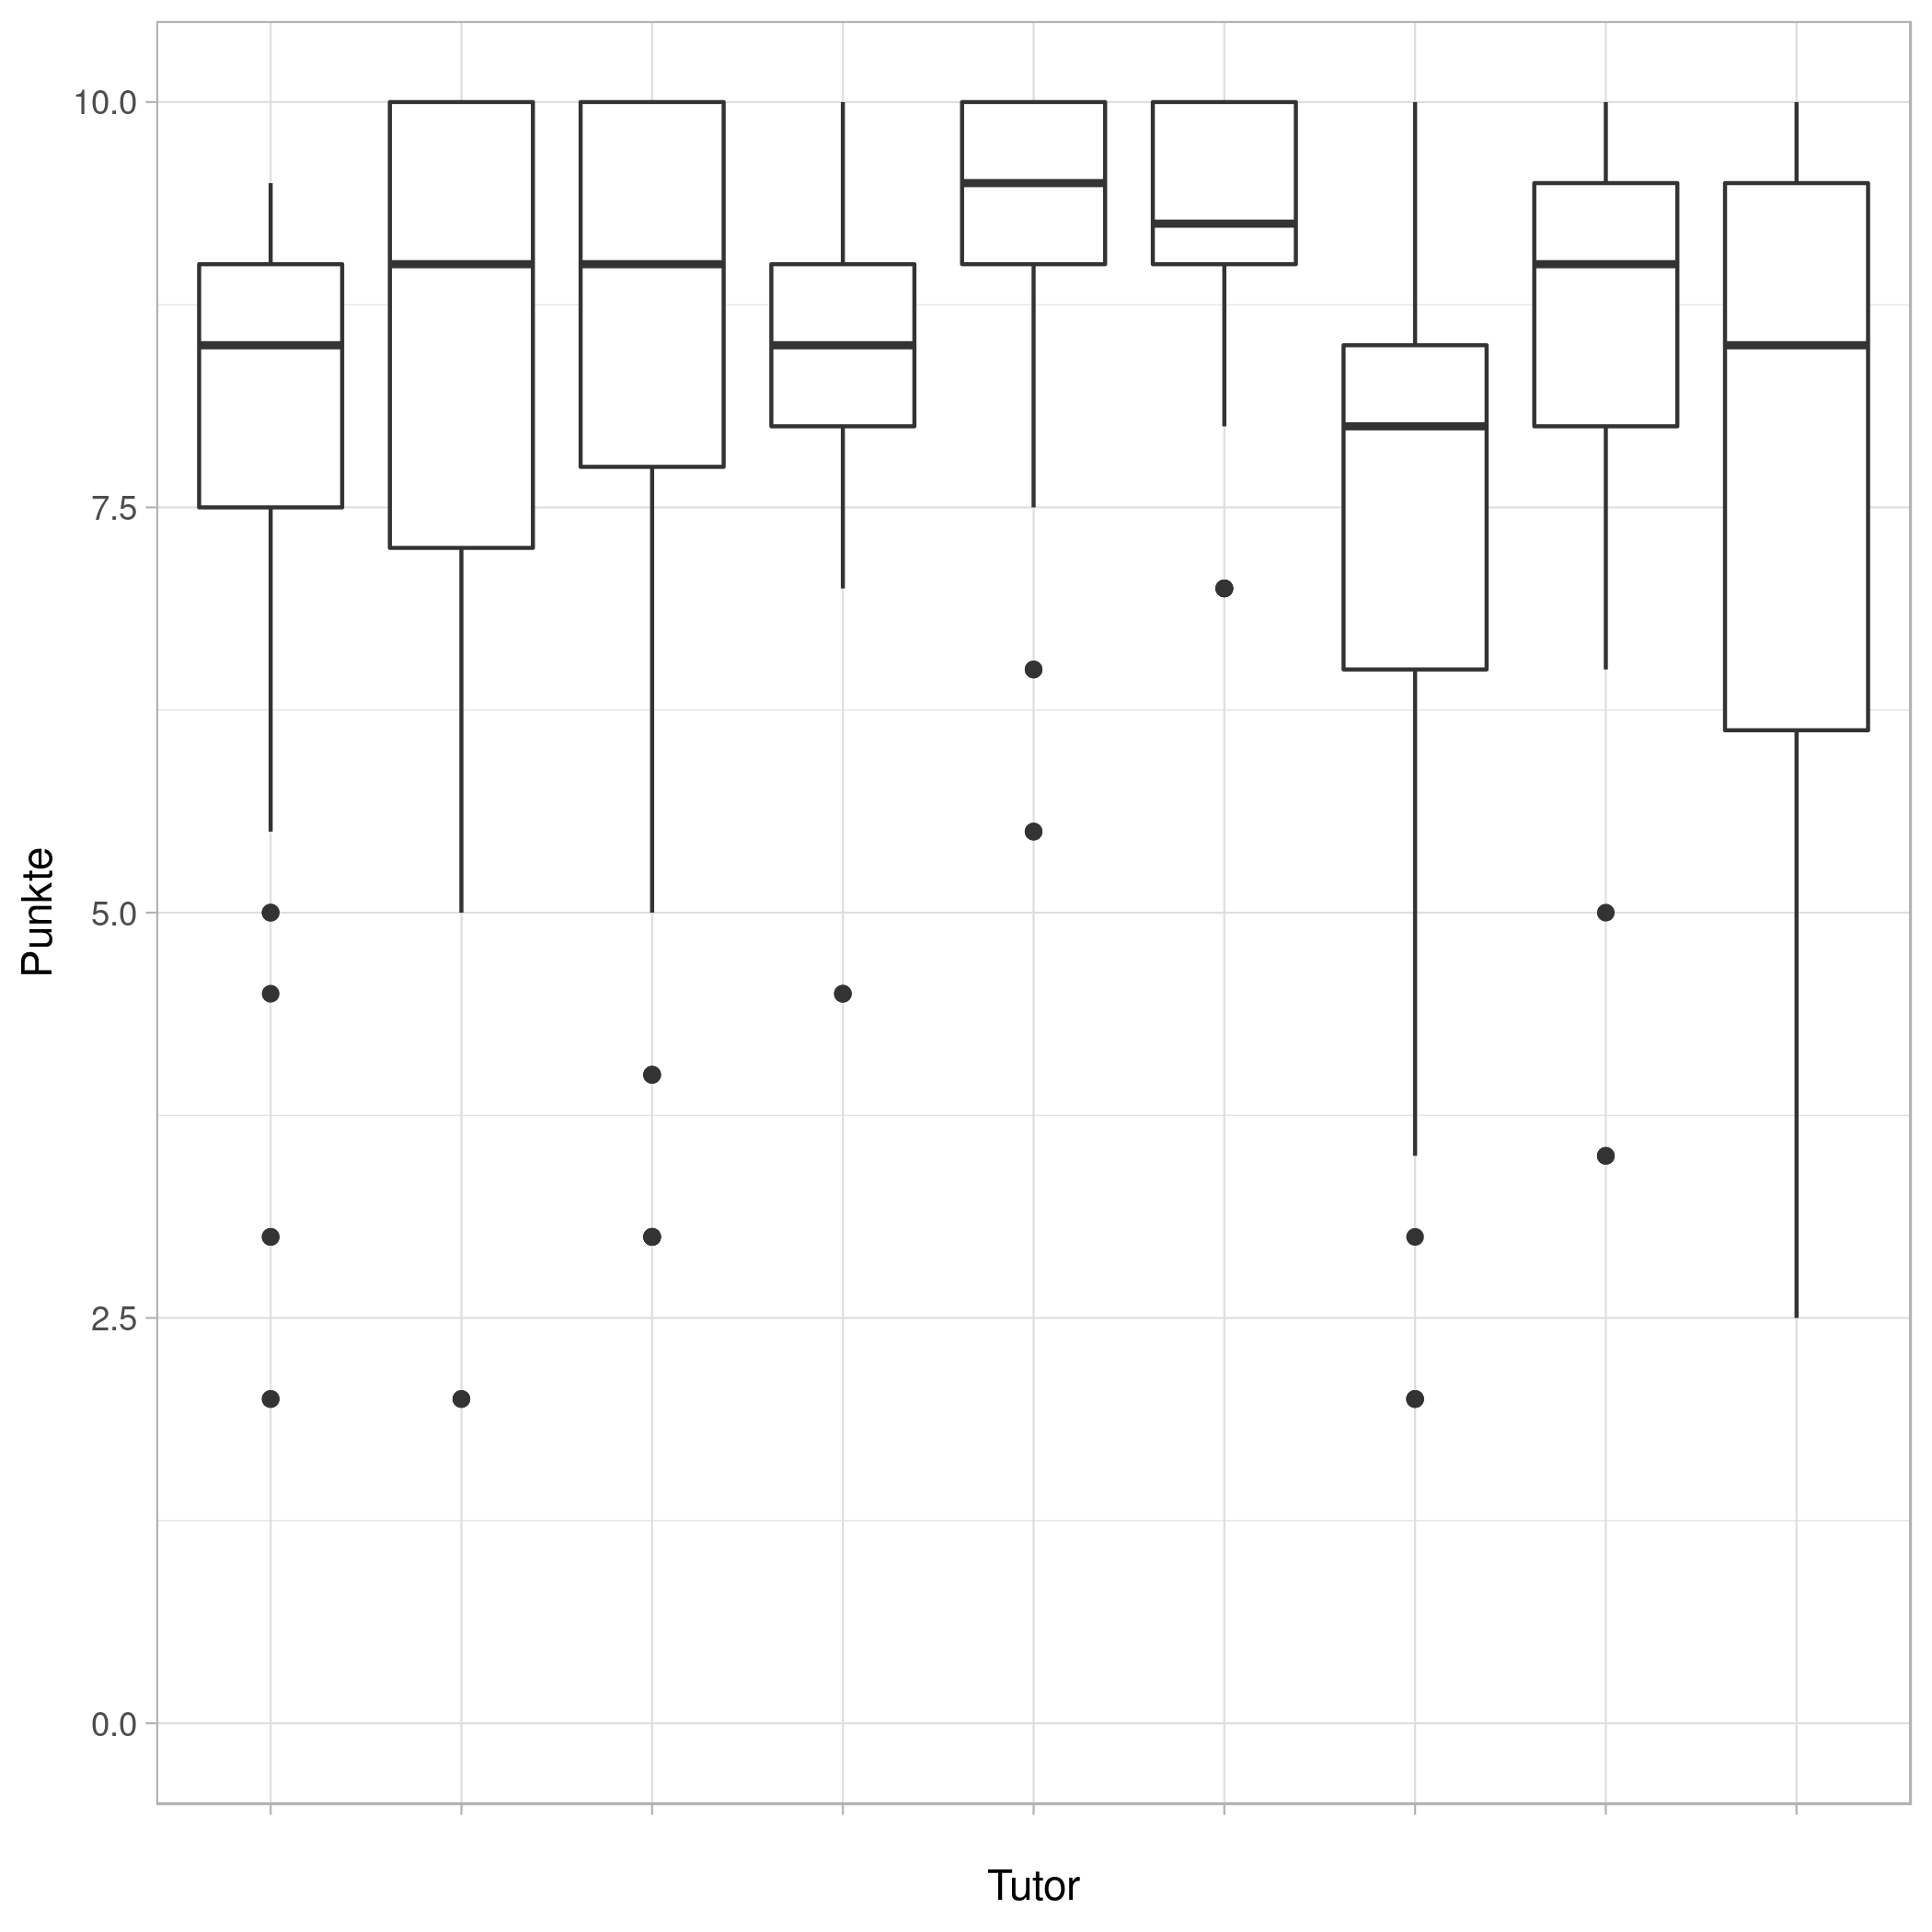
From the P-value alone, this already is significant and tells me that the tutor has a significant impact on the points given.
Also looking at a boxplot suggests that there are differences:
However, the Sum Sq column has a very large unexplained residual. From this I deduce that I could do better and the model does not really fit the data well. Looking at the Mean Sq however, the residuals are not so bad in comparison. Which of the two numbers do I have to look at? In the infinite statistics limit, I expect only the Mean Sq to be meaningful as the Sum Sq of the residuals will just grow linearly.
It could be possible that the tutors that appear strict just have been assigned the weak students by chance. If one takes into account that students have different levels intrinsically, then perhaps the effect of the tutor is reduced. So I have added the student as an independent variable as well such that the model reads Points ~ Tutor + Student. The output now is this:
           Df Sum Sq Mean Sq F value    Pr(>F)
Tutor       8 145.89 18.2358 11.5730 1.299e-14 ***
Student    96 695.86  7.2485  4.6001 < 2.2e-16 ***
Residuals 351 553.08  1.5757
The sum of squares for the Tutor variable has not changed, but it's F-value has increased, making this more significant now. Also the residuals have reduced a lot, so this seems like a good addition to the model?
Does the lower P-value for the Student dependence compared to the Tutor dependence tell me that it more depends on the student than on the tutor, an indication that the grading procedure is fair?
The assignments did not all have the same difficulty, so perhaps this has also an influence. Doing Points ~ Tutor + Student + Assignment gives me this:
            Df Sum Sq Mean Sq F value    Pr(>F)
Tutor        8 145.89 18.2358 12.6994 4.964e-16 ***
Student     96 695.86  7.2485  5.0479 < 2.2e-16 ***
Assignment   4  54.80 13.7007  9.5412 2.497e-07 ***
Residuals  347 498.28  1.4360
Apparently the assignments were also different enough for this to get a low P-value. There are only four degrees of freedom as only five assignments have been fully graded up to this point.
Just out of curiosity I have added the interaction effect of tutor and assignment. Perhaps each tutor interprets each assignment a bit different. That is the result:
                  Df Sum Sq Mean Sq F value    Pr(>F)
Tutor              8 145.89 18.2358 14.3168 < 2.2e-16 ***
Student           96 695.86  7.2485  5.6907 < 2.2e-16 ***
Assignment         4  54.80 13.7007 10.7563 3.471e-08 ***
Tutor:Assignment  31  95.78  3.0895  2.4256 6.637e-05 ***
Residuals        316 402.50  1.2737
All of these things have extremely low P-values, which starts to sound dubious.
My background is Physics, not Psychology. Therefore I am not so sure which of these models actually is the one to choose and how to interpret is. Which one best matches my actual question at hand? And how would I interpret these P-values?

